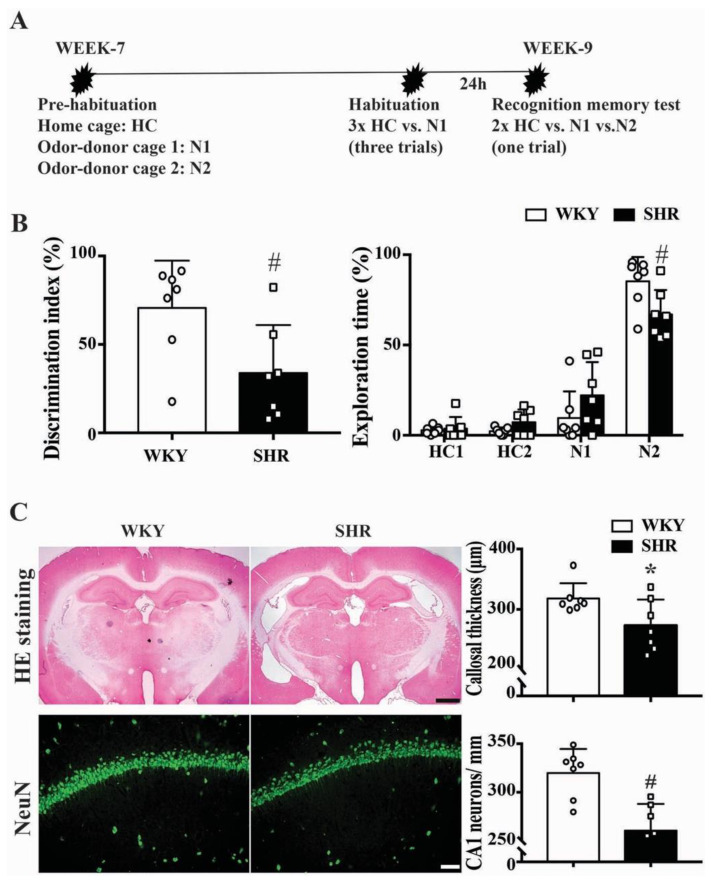
Figure 3.
(A) Representation of the experimental procedure. HC = home cage bead; N1 = familiar odor bead; N2 = unfamiliar novel odor bead. (B) Bar graphs showing the discrimination index ratio (%) and the exploration time on the N2 bead in at week 9 in male WKYs and SHRs. Values are the means ± SD, n = 7; # p < 0.01 compared with the WKY group. (C) Representative H&E stained coronal sections from WKYs and SHRs at week 9 (scale bar = 1 mm) that were used to determine corpus callosum thickness, and representative NeuN immunoreactivity in the hippocampus CA1 area (scale bar = 50 μm) that was used to determine neuronal loss. Quantification of the results are shown in the bar graphs. Values are the means ± SD, n = 7; * p < 0.05, # p < 0.01.

