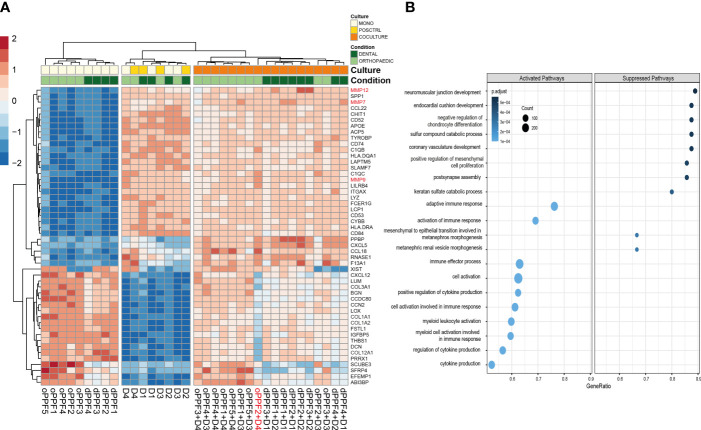
Figure 7.
Top 50 genes and Gene Ontology Biological Pathway analysis on day 20. RNA-Sequencing data for orthopaedic and dental monolayer cultures on day 20: Top 50 genes that are differentially expressed between mono- and co-cultures, D (Donor)=PBMC (A); Gene Ontology Biological Pathway analysis for mono- and co-cultures. Size of the dots are defined by the Gene Counts, color of the dots represent p-adjusted value (B).

