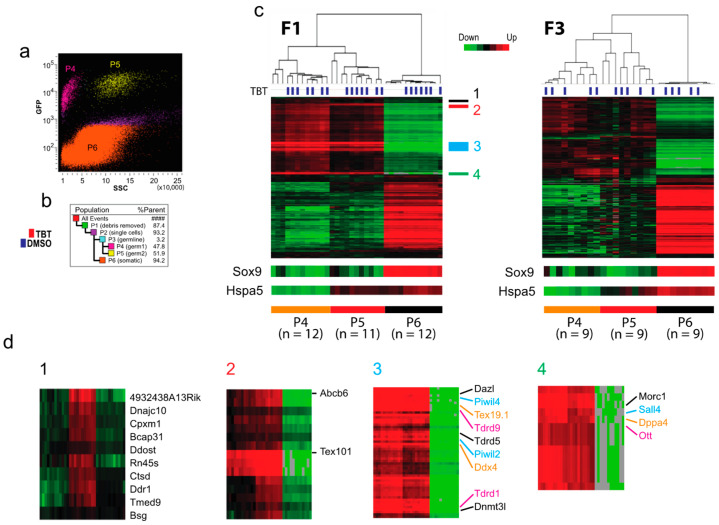
Figure 3.
Transcriptomes of F1 and F3 fetal testicular cells. (a,b) FACS enrichment of EGFP+ germline cells (P4 and P5) and EGFP- somatic cells (P6) from E18.5 fetuses. (a) Germline and somatic cell populations isolated by FACS with GFP and side scatter (SSC) intensities. (b) Relative sizes of cell populations. (c,d) Heatmap representations of unsupervised hierarchical clustering of transcriptomes determined by RNA-seq for F1 and F3 testicular cells. Transcriptomes of animals whose F0 mother was exposed to TBT are labelled by blue rectangles. The green-red colors indicate down- and up-regulation of genes. Parts of transcriptomes in panel (c) are enlarged in panel (d).

