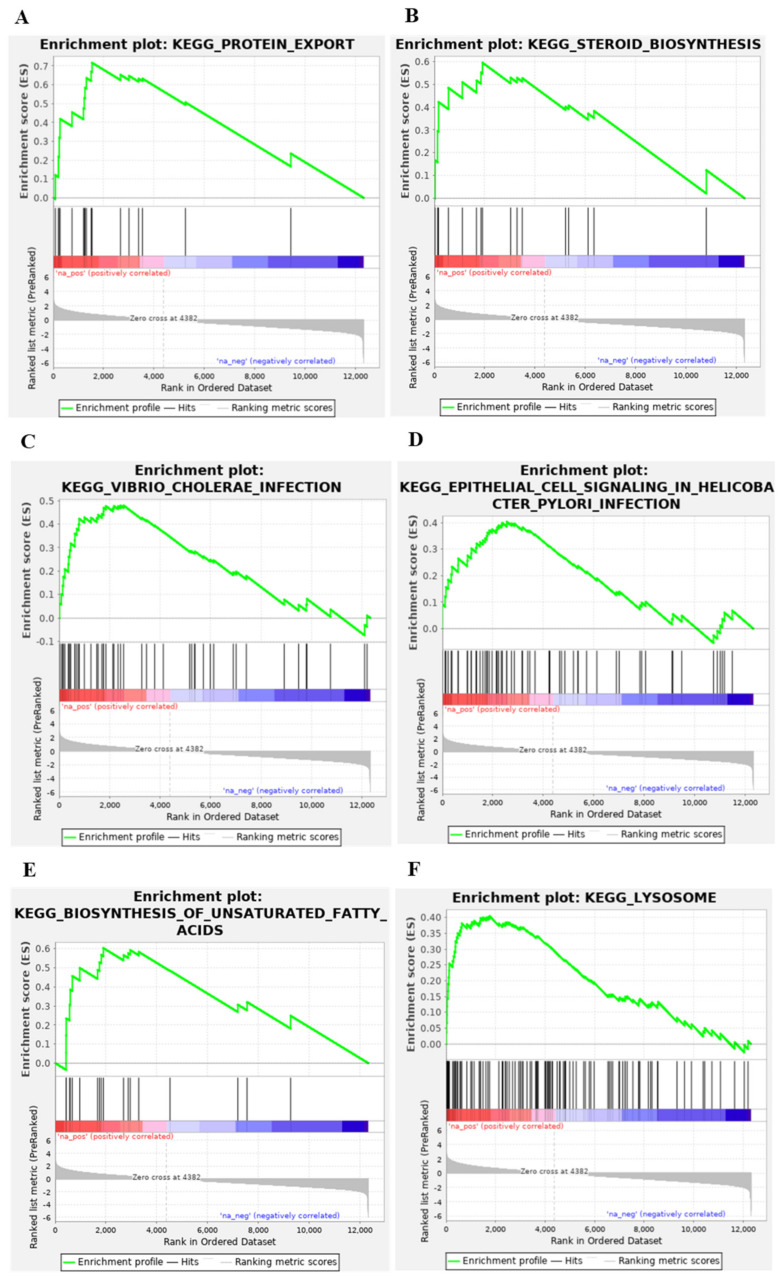
Figure 3.
GSEA enrichment plots of the six endocytosis-related pathways upregulated by mefloquine. We ran GSEA on the mefloquine gene expression signature obtained from CMAP to identify KEGG pathways enriched in differentially expressed genes. The six endocytosis-related pathways with a significant enrichment score (FDR < 0.05) are shown here. Subplots contain an identical colored bar, representing the complete gene list ordered by changes in the expression levels induced by mefloquine, with red indicating the highest z-scores (upregulated genes), and blue the lowest ones (downregulated genes). Each subplot corresponds to a pathway and black vertical lines indicate the position of its genes in the ordered list. Note that for all six pathways, these lines tend to be located towards the top of list (upregulated genes). The GSEA enrichment score is computed iteratively across the ordered list, as shown in green. The final GSEA enrichment score of each pathway (reported on Table S1) is the highest deviation from zero. The bottom portion of the plot shows the z-score (y-axis) at each position of the list (x-axis).

