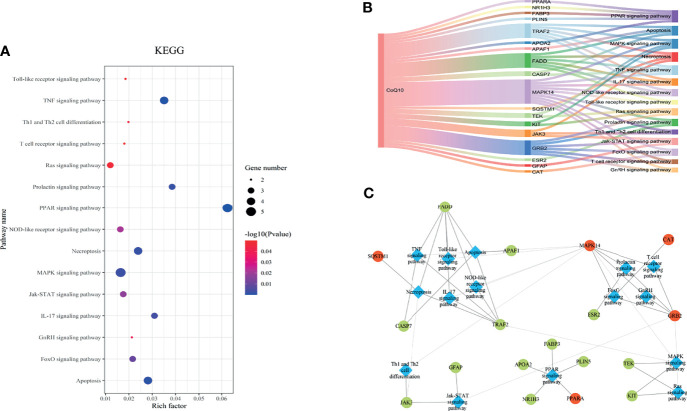
Figure 4.
The KEGG pathway analysis of the 27 potential therapeutic targets. (A) The 15 significant pathways. The bubbles’ sizes are indicated from big to small in descending order of the count of the potential targets enriched in the pathways. The bubbles’ colors are indicated from red to blue in descending order of -lg (p-value). (B) CoQ10-targets-pathways network. The width of the line is proportional to the number of connected points. (C) Module analysis of the target-pathway network. The diamond nodes represent the pathways, and the ellipse nodes represent the targets. The red nodes represent the hub genes obtained from the PPI network of potential therapeutic targets.

