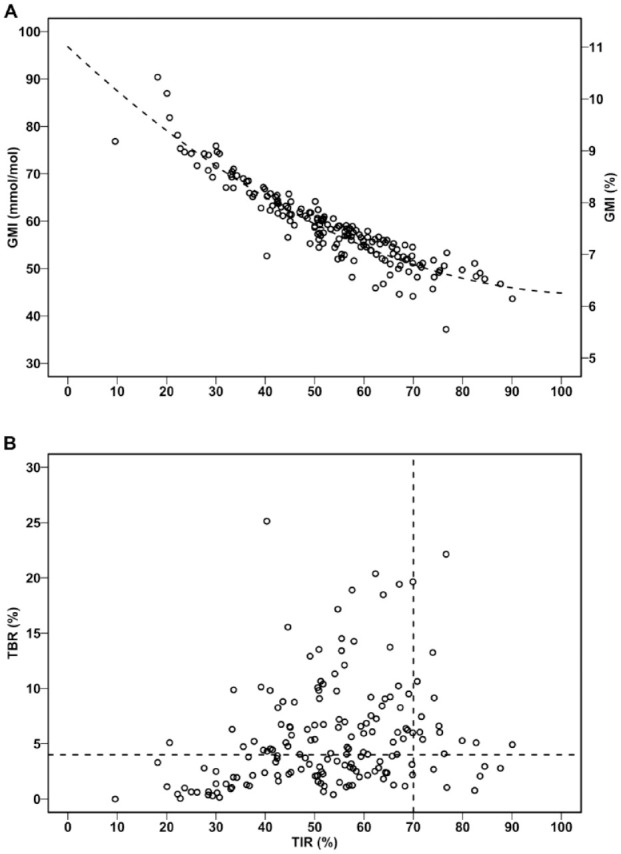
Figure 5.

The relation between TIR and GMI (a) and TBR (b) obtained from 60 days of 15-min glucose average.
The vertical and horizontal dotted lines represent TIR 70% and TBR 4%, respectively. GMI, glucose monitoring indicator; TBR, time below range; TIR, time in range.
