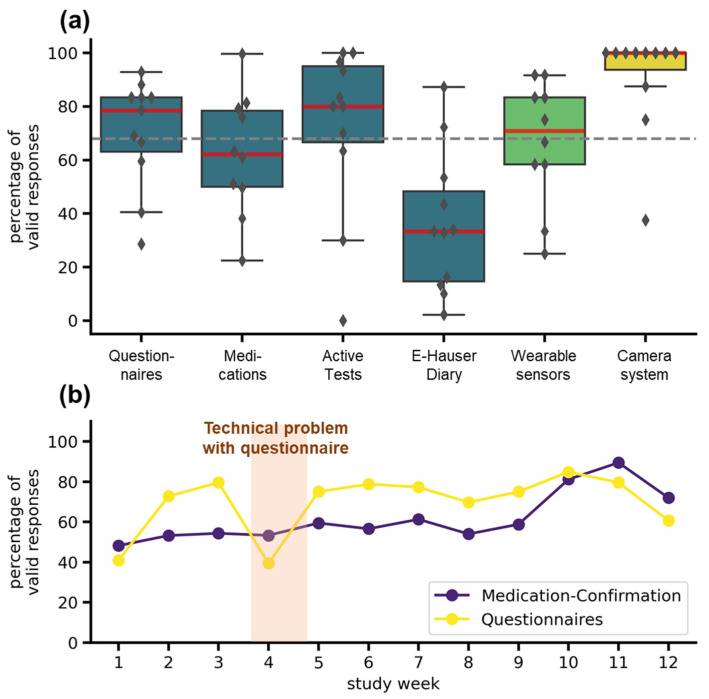
Figure 5.
Adherence to different telemedical components. (a) Adherence for all telemedical components over the entire study duration. The boxplots show median (red line), interquartile range (boxes), and total range (whiskers). Markers represent adherence for individual patients. The colors indicate the systems: TelePark-App (blue), wearable sensors (light green), and camera-system (yellow). The dashed grey line represents the target completion rate of 68%. (b) Weekly adherence to questionnaires and medication confirmations in the TelePark-App throughout the study. The line plot shows the mean percentage of valid confirmations of all patients for each week.

