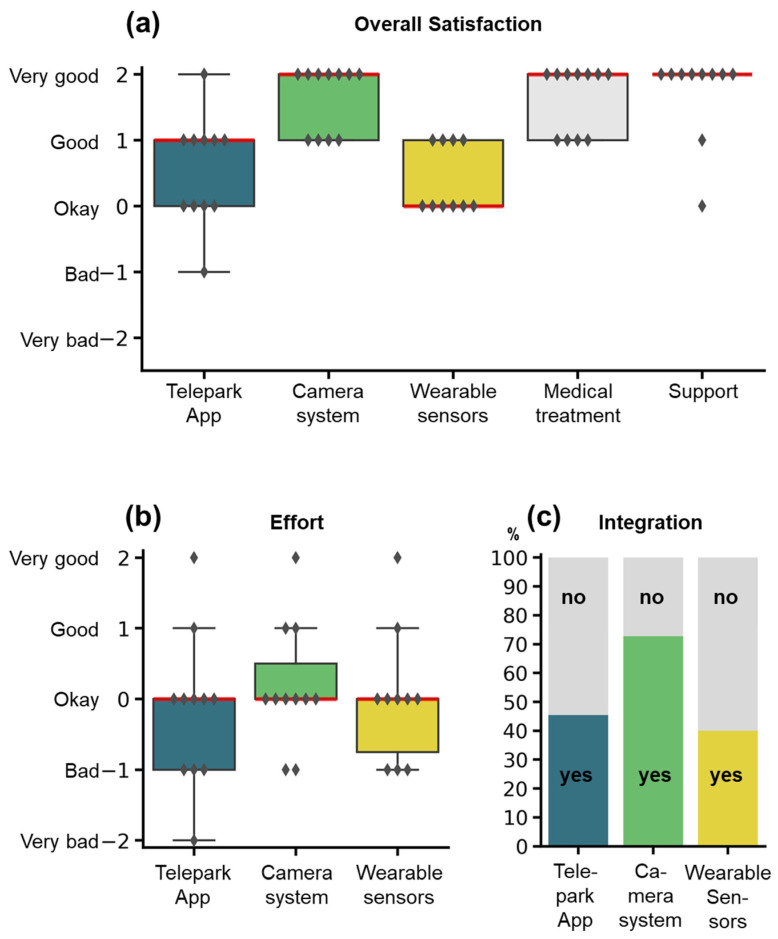
Figure 6.
Rating of the study components by the participants. Items were assessed by semi-standardized questionnaires at the end of the study. (a) Overall satisfaction for the different study components. (b) Effort for using the wearable sensors, the camera-system, or the TelePark-App. (c) Integration into the everyday life of the three different systems. Satisfaction and effort were rated on a 5-item Likert scale, integration into everyday life with a binary question (yes/no). Boxplots show median (red line), interquartile range (boxes), and total range (whiskers). Markers represent responses for individual patients. The stacked barplot shows percentages of the answers yes (colors) or no (grey).

