
Figure 2.
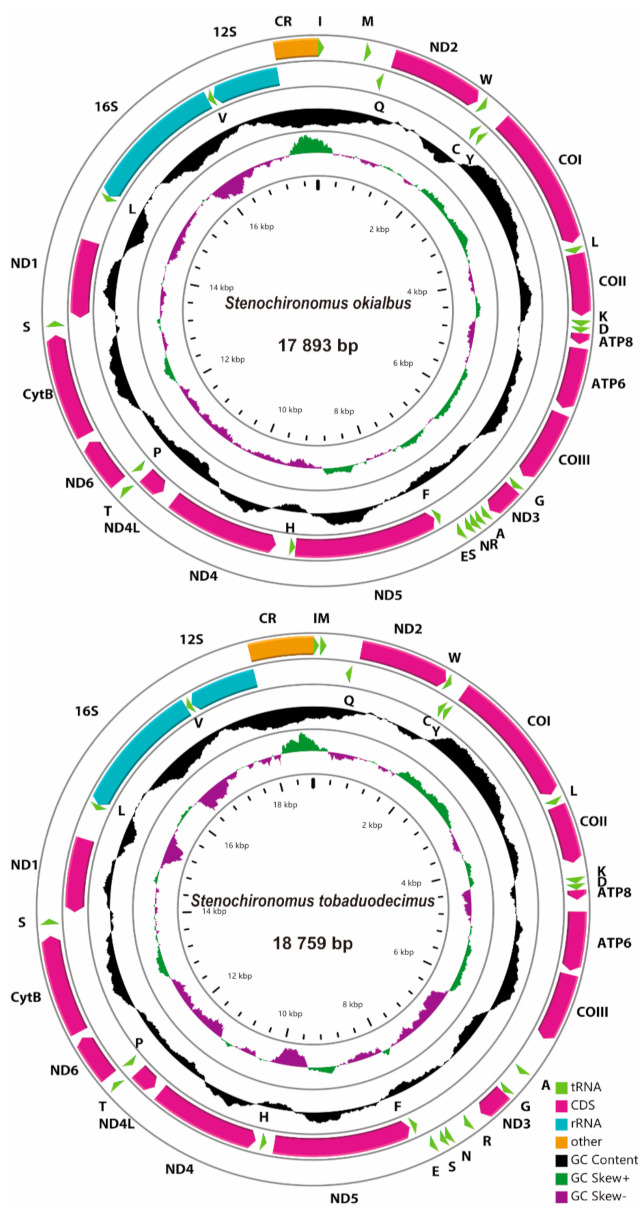
Mitogenome maps of the represented species of Stenochironomus. The names of PCGs and rRNAs are indicated by standard abbreviations, while names of tRNAs are represented by a single letter abbreviation. The first circle shows the gene arrangement and arrows indicate the orientation of gene transcription. Red, blue, green, and yellow arrows refer to PCGs, rRNAs, tRNAs, and the control region, respectively. The second circle indicates the GC content, which is plotted as the deviation from the average GC content of the entire sequence. The third circle shows the GC-skew, which is plotted as the deviation from the average GC-skew of the entire sequence. The innermost circle shows the sequence length.