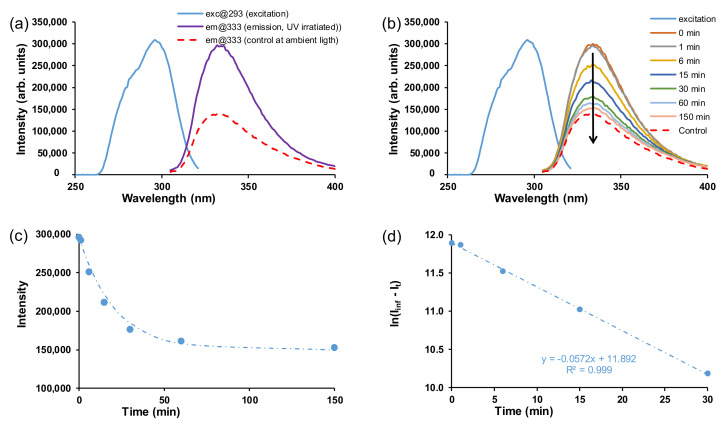
Figure 8.
(a) Fluorescence spectra of the 10 ppm AZB(COOH)2 ligand. The excitation curves for both trans and cis overlapped at 293 nm and their emission curves are shown at 333 nm. (b) UV-irradiation followed by excitation and decay of the excitation curve under ambient light. (c) Intensity (I) vs. time and (d) ln(Iinf − It) vs. time.

