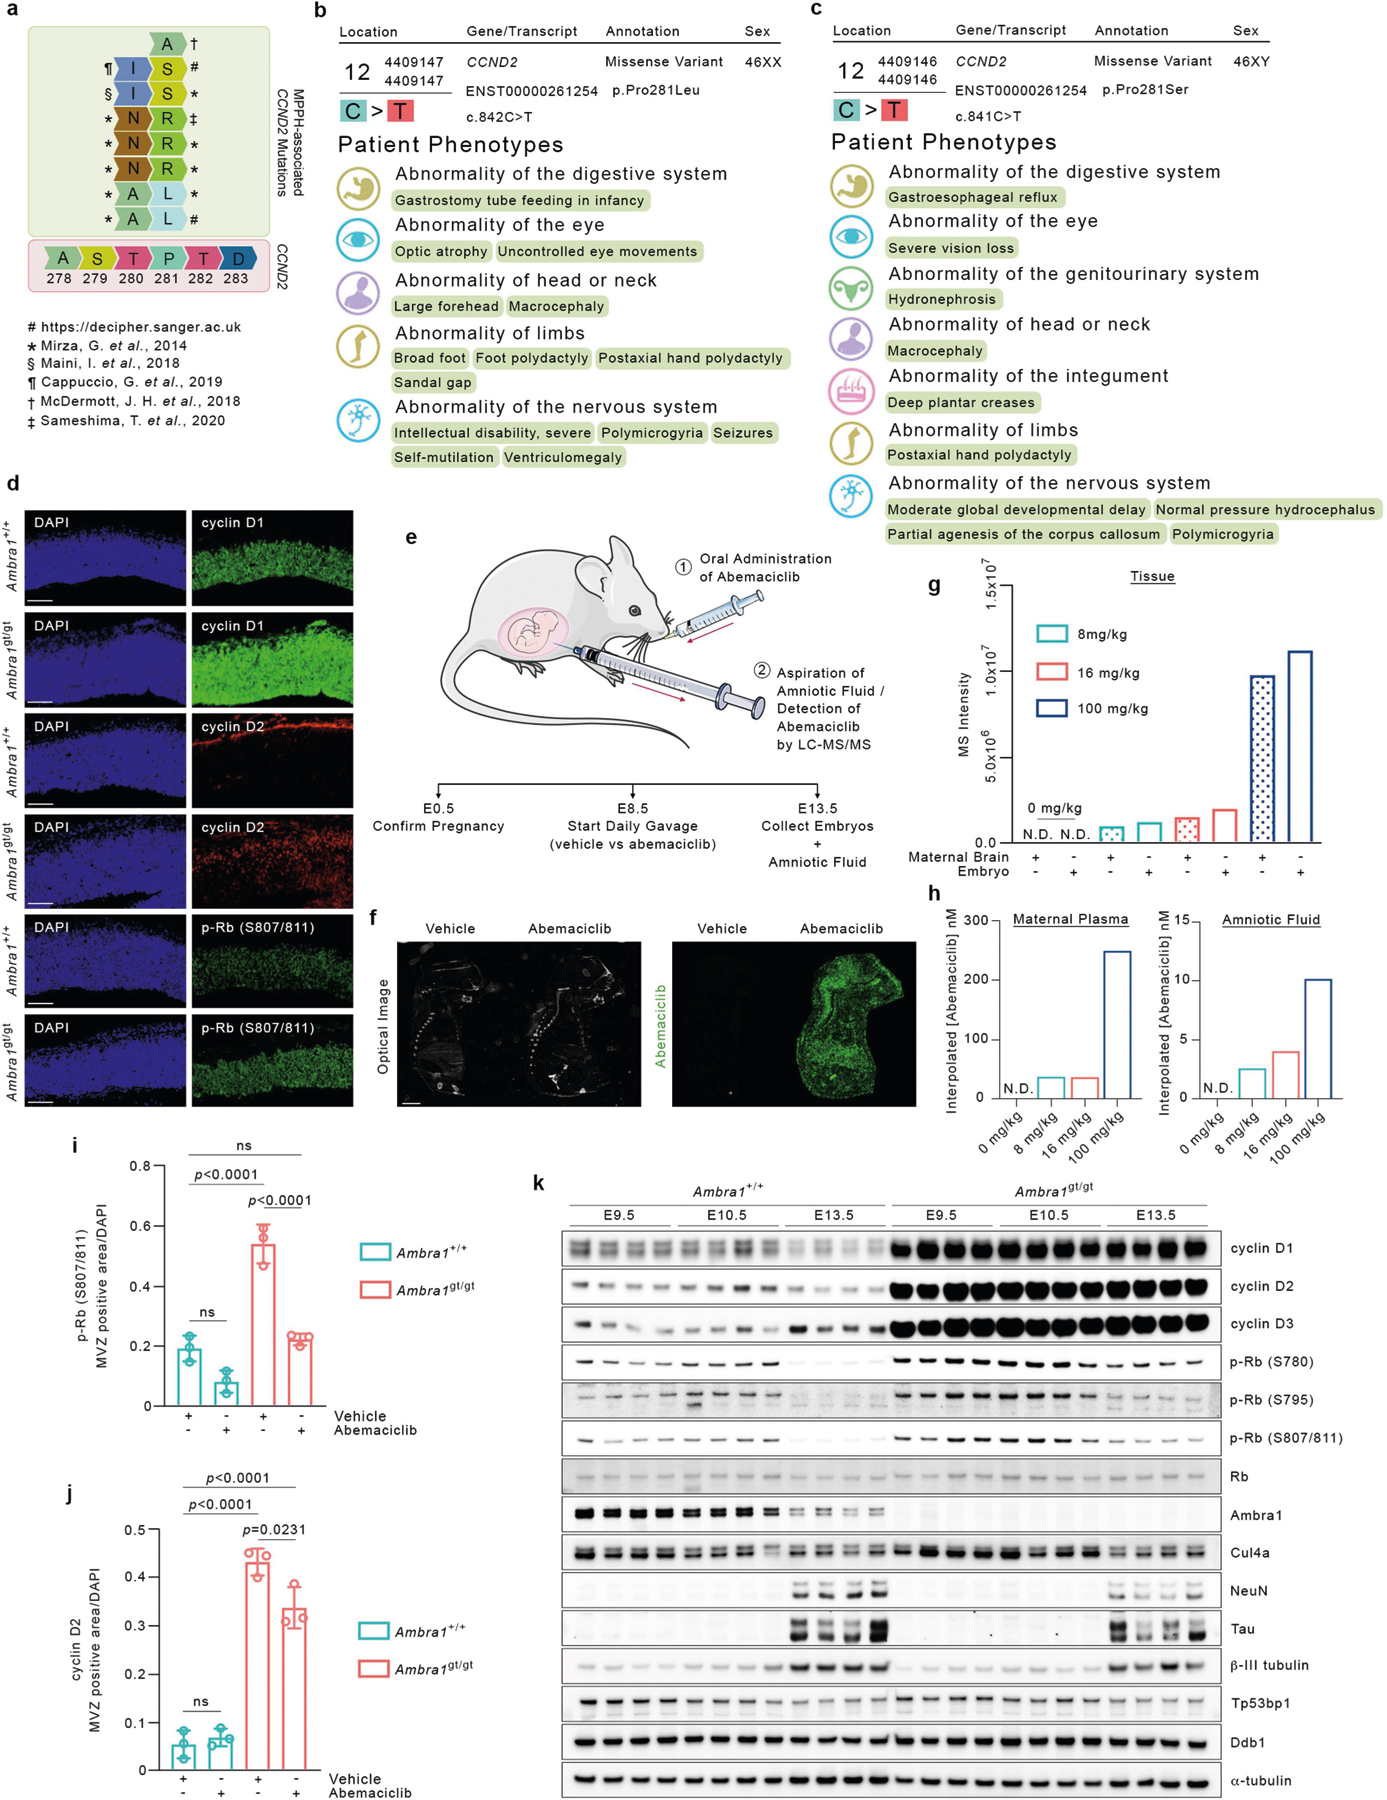
Extended Data Fig. 6 |. Report of MPPH-derived mutations in CCND2 and evidence of the ability of abemaciclib to cross the murine placental barrier.

a, Graphical representation of MPPH-associated CCND2 mutations affecting T280 and P281 in cyclin D255–60. b, Genotype and clinical phenotypes of patient 295112 (https://decipher.sanger.ac.uk) 59. c, Genotype and clinical phenotypes of patient 305416 (https://decipher.sanger.ac.uk) 59. d, Representative immunofluorescent sections (20× magnification) of the mesencephalic ventricular zone of E13.5 Ambra1+/+ and Ambra1gt/gt embryos stained for cyclin D1, cyclin D2 or p-RB (S807/811). Scale bars, 100 μm. e, Experimental timeline of the daily, oral administration of abemaciclib to pregnant Ambra1gt/+ mice (from E8.5 to E13.5) (1), and collection of amniotic fluid via a 28G insulin syringe from the amniotic sacs of E13.5 embryos for subsequent LC-MS/MS analysis (2). f, Mass spectrometry imaging of abemaciclib in mouse embryos. Left, optical registration image of the slide with each section before MALDI imaging. Right, extracted ion mobility image for abemaciclib (green) as detected based on authentic standards [M+H]+ at 507.2791 m/z (±15 ppm) with a mobility (1/K0) of 1.177 (±1%), maternal dose of 100 mg kg−1. Scale bar, 2 mm. This experiment was performed once. g, h, MS intensity of abemaciclib in tissue samples (g), interpolated abemaciclib concentration in maternal plasma (h, left) and interpolated abemaciclib concentration in amniotic fluid (h, right). Maternal brain, embryonic tissue, amniotic fluid and maternal plasma samples were obtained from mice administrated with daily dosages of abemaciclib mesylate at 8 mg kg−1 or 16 mg kg−1 from E8.5 to E13.5, and at 100 mg kg−1 from E12.5 to E13.5. The abemaciclib MS intensity shown for tissue samples was corrected based on a 3× signal-to-noise cut-off with a floor of 10,000 using the blank controls. The abemaciclib concentration shown in both the amniotic fluid and plasma sample was interpolated based on the standard curve prepared in blank amniotic fluid and blank plasma, respectively. N.D., not detected. This experiment was performed once. i, j, E13.5 Ambra1+/+ and Ambra1gt/gt embryos were collected from pregnant mice treated with vehicle (PBS) or 8 mg kg−1 abemaciclib. Immunofluorescence from sections was quantified to show area of p-RB (S807/811) (i) and cyclin D2 (j) staining in the mesencephalic ventricular zone (MVZ). Data are mean ± s.d. p-Rb (S807/811), n = 3; cyclin D2, n = 3. Adjusted P values were calculated using a two-way ANOVA with Tukey’s multiple comparisons test. k, Protein extracts derived from E9.5, E10.5 and E13.5 Ambra1+/+ and Ambra1gt/gt embryo heads (four independent embryos per group) were immunoblotted for the indicated proteins. Unless otherwise noted, experiments were performed at least three independent times.
