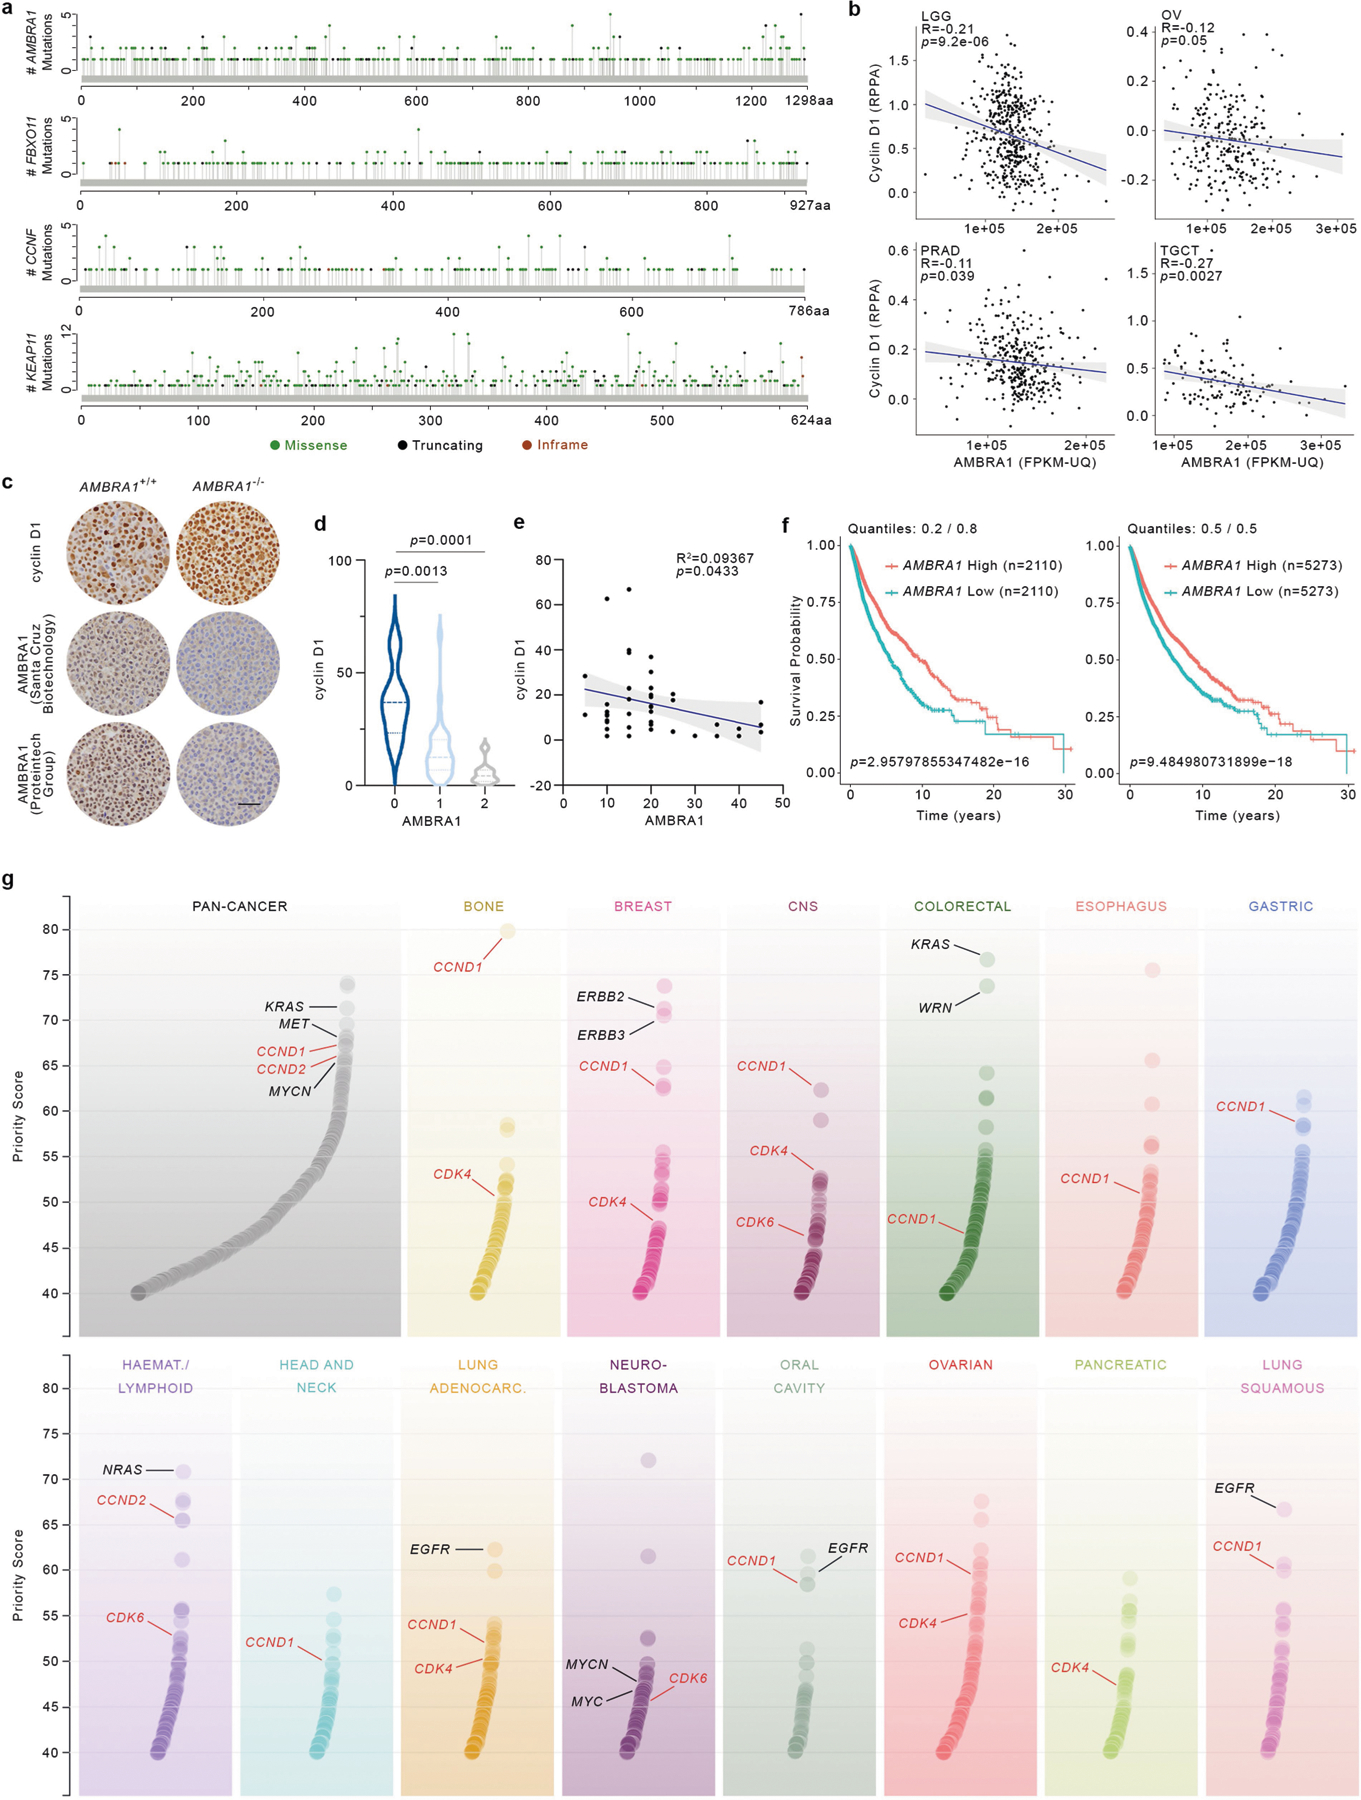
Extended Data Fig. 7 |. AMBRA1 and D-type cyclins in human cancer.

a, Lolliplots showing amino acid positions and numbers of mutations in AMBRA1, FBXO11, CCNF and KEAP1 in pan-cancer samples generated from cBioPortal (https://www.cbioportal.org/) and using the curated set of non-redundant studies36,37 (last accessed: December 2019). b, Scatter plot of cyclin D1 protein levels (RPPA) and mRNA expression levels of AMBRA1 (FPKM-UQ) in different TCGA cohorts. LGG, n = 435; OV, n = 257; PRAD, n = 344; TGCT, n = 124. Pearson correlation analysis was performed to calculate P and R values. The shaded area represents the 95% confidence interval of the regression line. c, Representative immunohistochemistry image fields of AMBRA1−/− and AMBRA1+/+ HCT-116 plasma-thrombin cell blocks stained with either a rabbit polyclonal anti-human AMBRA1 antibody (Proteintech Group 13762–1, lot nos. 00005112 and 00017852, RRID: AB_10642007), a mouse anti-human AMBRA1 clone G-6 antibody (Santa Cruz Biotechnology sc-398204, lot no. G1217, RRID: AB_2861324), or a rabbit anti-human cyclin D1 clone SP4 antibody (Ventana Medical Systems 790–4508, lot no. B08078, RRID: AB_2335988). Scale bar, 50 μm. This experiment was performed once. d, A TMA containing normal and tumour ovarian human specimens was immunostained with antibodies to AMBRA1 and cyclin D1. Violin plots show automated quantification of cyclin D1 intensity levels and pathological scoring of nuclear AMBRA1 intensity levels (0, no expression; 1, faint expression; 2, mild or moderate expression) (n = 44 biologically independent samples). Adjusted P values were calculated using a one-way ANOVA with Dunnett’s multiple comparisons test. e, The graph shows automated quantification of cyclin D1 and AMBRA1 intensity levels from the TMA described in d. n = 44 biologically independent samples. Pearson correlation analysis was performed to calculate P and R2 values. The shaded area represents the 95% confidence interval of the regression line. f, Kaplan–Meier plots showing survival probability of human cancer patients partitioned in low AMBRA1 mRNA levels (n = 2,110 for quantiles 0.2/0.8, and n = 5,273 for quantiles 0.5/0.5) and high AMBRA1 mRNA levels (n = 2,110 for quantiles 0.2/0.8, and n = 5,273 for quantiles 0.5/0.5; TCGA (https://cancer.gov/tcga)). P values were calculated using the log-rank test. Meta P values: 0.0389 (for quantiles 0.2/0.8), 0.0475 (for quantiles 0.5/0.5). g, Priority targets from pan-cancer and cancer-type analyses, as previously described9. CCND1, CCND2, CDK4 and CDK6 are highlighted in red. Select oncogenes are in black.
