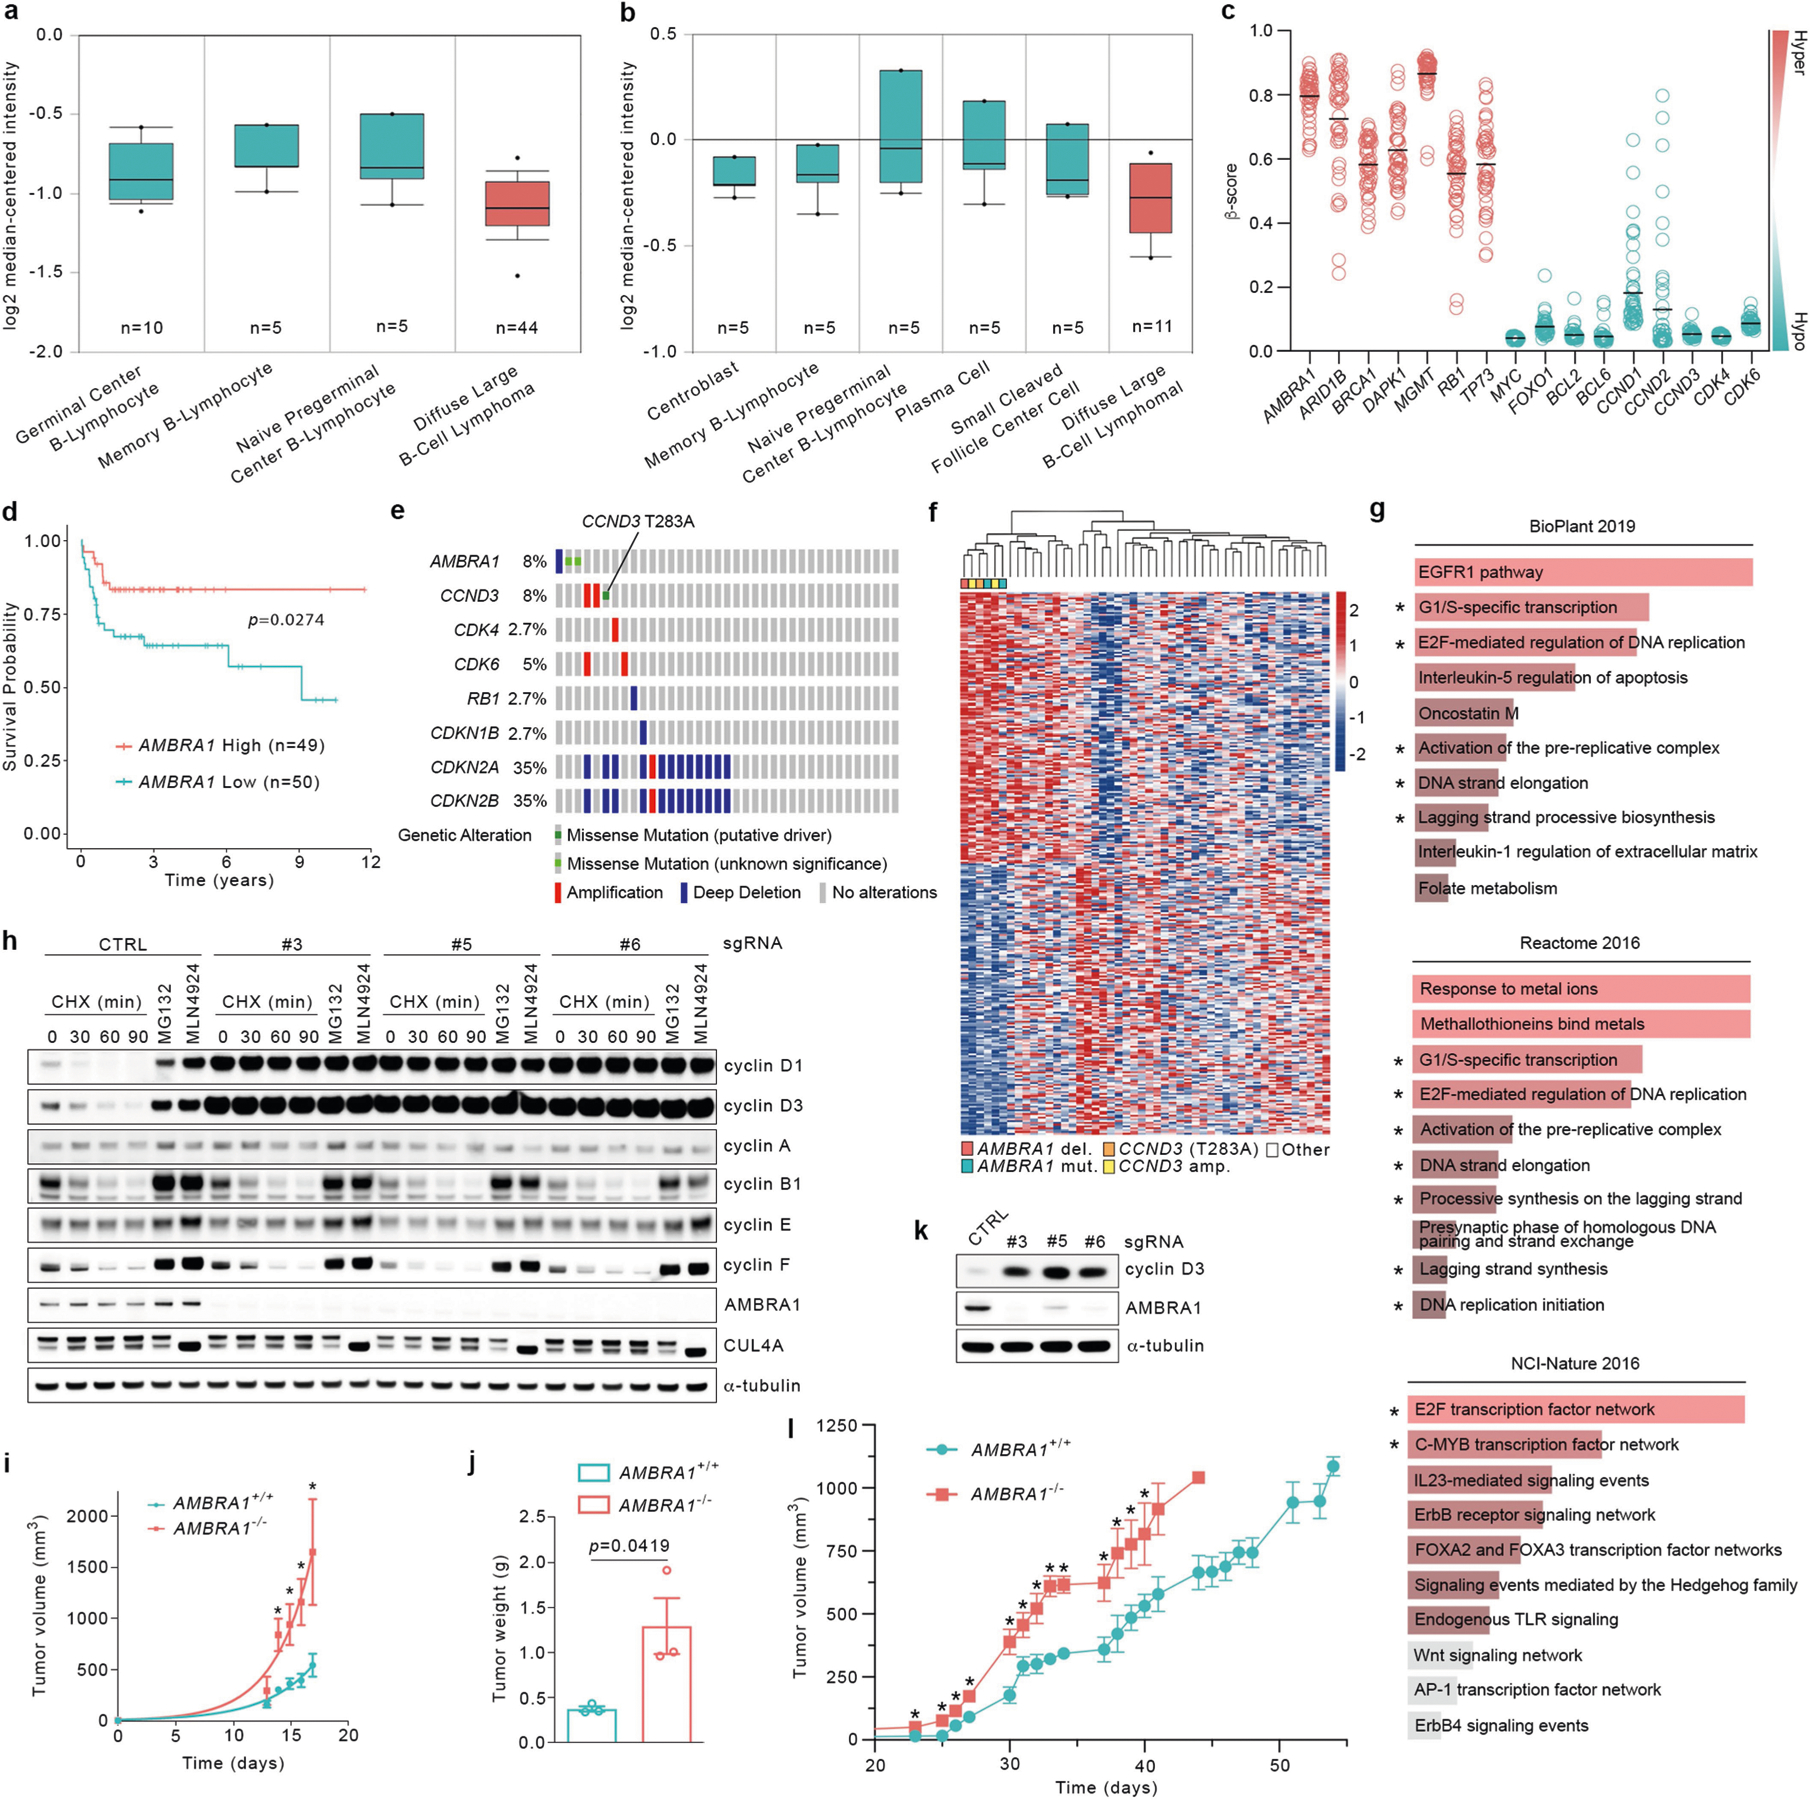
Extended Data Fig. 10 |. AMBRA1 is a tumour suppressor in DLBCL.

a, Differential expression of AMBRA1 in DLBCL compared with normal B-lymphocytes from Compagno et al.34. P = 9.91 × 10⁻⁶. b, Differential expression of AMBRA1 in DLBCL compared with normal B-lymphocytes from Brune et al.35. P = 0.003. a, b, Dots indicate maxima and minima; whiskers indicate 90th and 10th percentiles; box edges indicate 75th and 25th percentiles; and centre lines indicate median; P values were calculated using a Student’s t-test, as described (https://www.oncomine.org). c, TCGA-derived, CpG-aggregated methylation values (β-values) of AMBRA1 and other established hypermethylated genes in cancer (depicted in red) compared with hypomethylated genes (depicted in green) in DLBCL. Solid lines denote the mean of β-values for each group. d, Kaplan–Meier plot showing survival probability of patients with DLBCL partitioned in low AMBRA1 mRNA levels (n = 50) and high AMBRA1 mRNA levels (n = 49), combining GEO number GSE2350131 and GEO number GSE1084632, using probe 52731_at (https://www.oncomine.org) (0.10/0.90 quantiles). P values by log-rank test. e, OncoPrint map of the genetic alterations in AMBRA1 and selected RB-pathway genes; TCGA DLBC cohort. f, Heat map showing hierarchical clustering of transcriptional signatures of tumours bearing alterations in either AMBRA1 or CCND3, derived from TCGA DLBC cohort. del, deletion; mut, mutation; amp, amplification; other, tumours bearing unaltered AMBRA1 and CCND3. AMBRA1 (RefSeq XM_005253009) mutations: R439K and D1287G. CCND3 (RefSeq NM_001760) mutation: T283A. g, Gene enrichment analysis of the top 300 most differentially expressed genes in patients harbouring alterations in AMBRA1 and CCND3 from TCGA (DLBC cohort) was performed using Enrichr (https://amp.pharm.mssm.edu/Enrichr/) with BioPlant (2019), Reactome (2016) and NCI-Nature (2016) databases. Asterisks indicate pathways regulated by D-type cyclins. h, BJAB cells were infected with lentiviruses expressing either one of three independent sgRNAs targeting AMBRA1 or one sgRNA targeting luciferase as control (CTRL). Upon FACS sorting, cell populations were treated with cycloheximide for the indicated times, MG132 or MLN4924 (for 4 h) before collection. Cell extracts were immunoblotted for the indicated proteins. i, BJAB cells expressing either control sgRNA targeting luciferase or sgRNA targeting AMBRA1 were xenotransplanted in NSG mice via subcutaneous flank injections. Tumour volume was calculated by caliper measurement. Data are mean tumour volume ± s.d. (n = 3 per group); nonlinear (exponential growth) fitted curves. P values by unpaired, multiple-comparison t-test using the Holm–Sidak method. Day 0: NS; day 13: P = 0.1885]; day 14 P = 0.0045; day 15: P = 0.0083; day 16: P = 0.0048; day 17: P = 0.0223. *P < 0.05. j, The weight of tumours described in i was measured on excised tumours at the experimental end point. Data are mean tumour weight ± s.e.m. (n = 3 per group). P values by unpaired t-test. k, U-2932 cells were infected with lentiviruses expressing either one of three independent sgRNAs targeting AMBRA1 or one sgRNA targeting luciferase as control (CTRL). Upon FACS sorting, cell populations were collected, and cell extracts were immunoblotted as indicated. l, U-2932 expressing either control sgRNA targeting luciferase or sgRNA targeting AMBRA1 were xenotransplanted in NSG mice via subcutaneous flank injections. Tumour volume was calculated by caliper measurement. Data are mean tumour volume ± s.e.m. (n = 5 per group at day 0). P values by unpaired, multiple-comparison t-test using the Holm–Sidak method, until day 40 (the latest time point where at least 3 mice per group were available). Day 23: P = 0.0008; day 25: P = 0.0191; day 26: P = 0.0133; day 27: P = 0.0041; day 30: P = 0.0079; day 31: P = 0.0292; day 32: P = 0.0148; day 33: P = 0.0002; day 34: P = 0.0001; day 37: P = 0.0165; day 38: P = 0.0306; day 39: P = 0.0240; day 40: P = 0.0401. *P < 0.05. These data are from the same dataset shown in Fig. 4c. Unless otherwise noted, experiments were performed at least three independent times.
