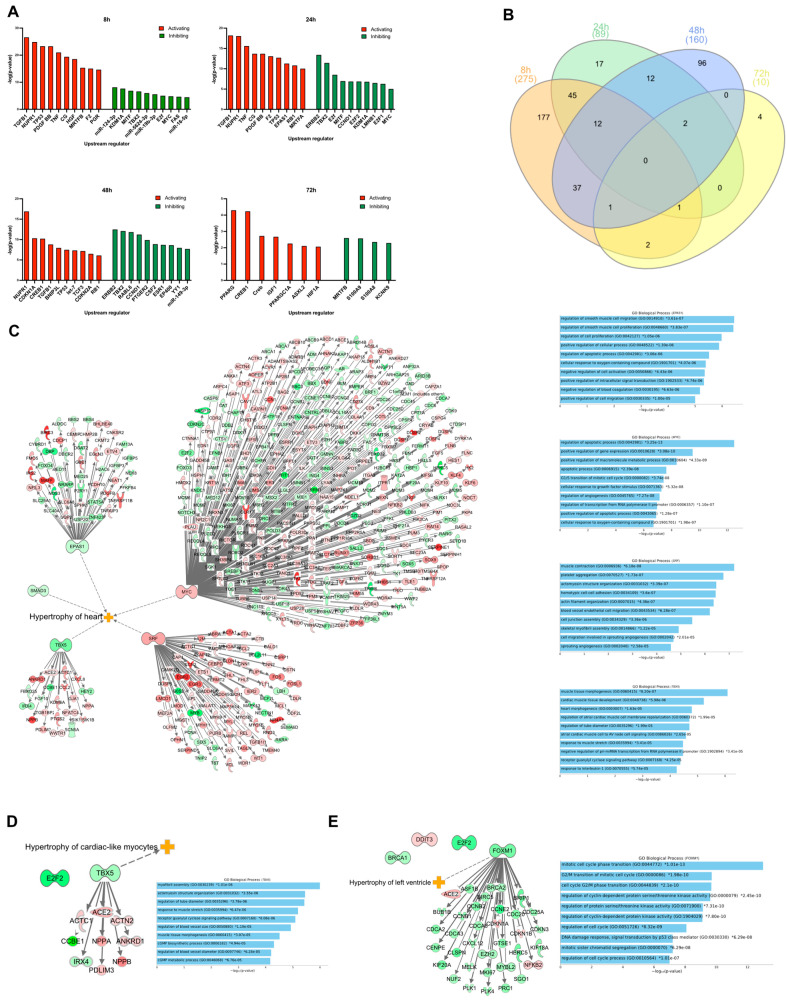
Figure 3.
Upstream and transcription regulator analysis. (A) Graphs show the predicted top 10 most activated or inhibited upstream regulators at 8, 24, 48, and 72 h. The y-axis shows the −logP value of the overlap between the genes in the dataset and genes regulated by an upstream regulator. Red and green bars represent activated and inhibited regulators, respectively. (B) Venn diagram showing the overlap of upstream regulators between the different time points. (C) Transcription regulators that were differentially expressed at 8 h. Dotted line shows transcription regulators that have an association with IPAs hypertrophy of heart classification. (D) Transcription regulators that were differentially expressed at 24 h. Dotted line shows which transcription regulator that have an association with IPA’s ‘Hypertrophy of cardiac-like myocytes’ classification. (E) Transcription regulators that were differentially expressed at 48 h. Dotted line shows which transcription regulator that has an association with IPA’s ‘Hypertrophy of left ventricle’ classification. Tables to the right of the (C–E) show the GO biological processes terms that were enriched when analyzing the TRs target genes that were differentially expressed at the indicated time point.

