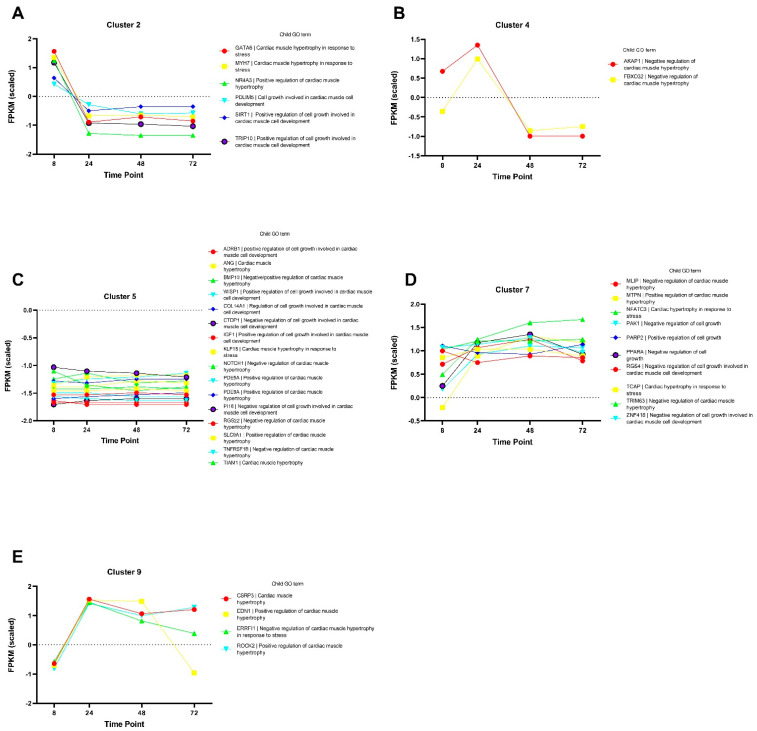
Figure 5.
Cluster analysis of genes annotated with the GO term 0003300 ‘Cardiac muscle hypertrophy’. Panels (A–E) show the genes included in a particular cluster generated with the k-means cluster algorithm. The y-axis shows normalized FPKM values, and the x-axis shows the different time points. The tables to the right of the graphs show a description of the child GO term associated with each gene.

