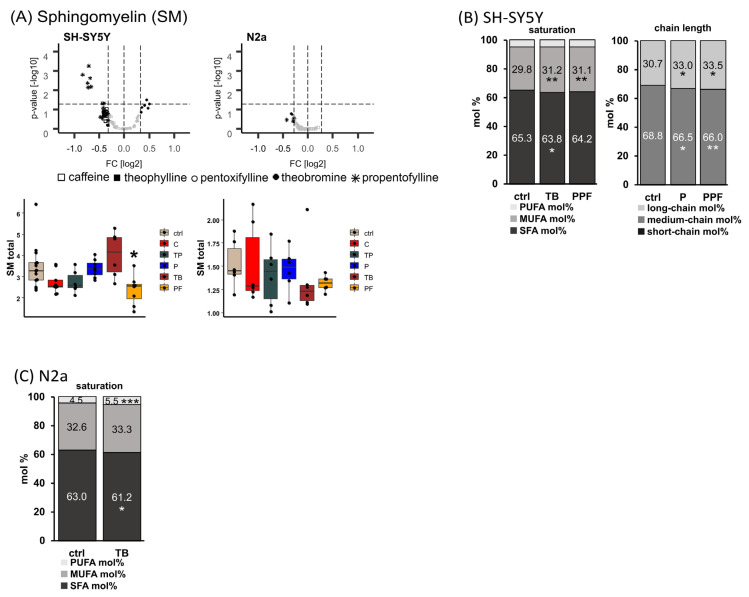
Figure 5.
Alterations of sphingomyelin (SM) levels in different cell lines (SH-SY5Y and N2a) in the presence of the analyzed MTX caffeine (C), theophylline (TP), pentoxifylline (P), theobromine (TB) and propentofylline (PPF). (A) SM total. Relative changes of SM species in comparison to cells treated with the solvent control are presented in volcano plots for each examined cell line. Volcano plots are constructed as described in the caption of Figure 2. Below the volcano plots, the relative changes are presented in boxplots for the corresponding cell line as fold changes to the solvent control. (B) SH-SY5Y cells. Distribution of saturated (SFA), monounsaturated (MUFA) and polyunsaturated (PUFA), as well as short-, medium- and long-chain SM species in SH-SY5Y cells treated with TB, P and PPF. Short-chain was defined as <C32:X, medium-chain as C34:X–C38:X and long-chain as >C40:X for SM species throughout the manuscript. (C) N2a cells. Distribution of SFA, MUFA and PUFA SM species in N2a cells treated with TB. (B,C) are shown as boxplots in Supplemental Figure S5. (* p < 0.05, ** p < 0.01, *** p < 0.001).

