Figure 2.
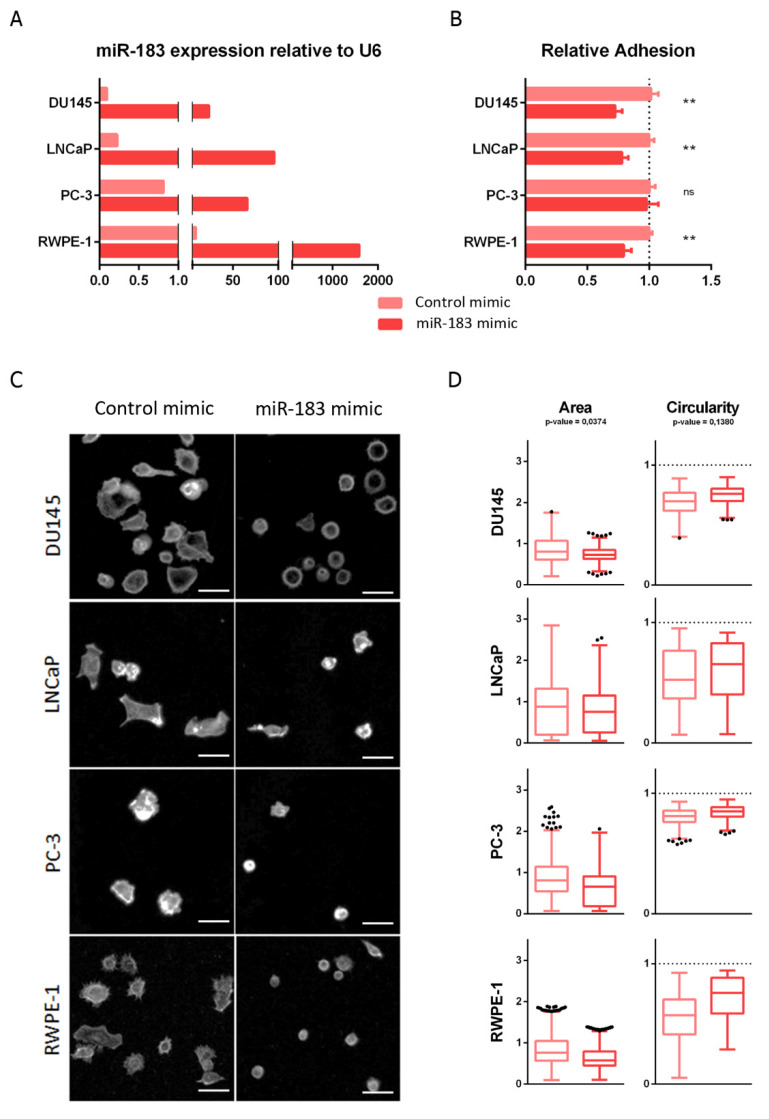
Effect of miR-183 on cell adhesion. (A) RT-qPCR measurement of miR-183 relative to RNAU6 (2−∆∆CT) 72 h after transfection of 20 nM miR-183 mimic or control RNAs in the indicated cell lines. (B) For the cell adhesion assay, the cells were harvested 72 h after transfection and seeded on cell culture surface-treated polystyrene 96-well plates, then allowed to adhere for 0.5 or 1 h (depending on the cell line), and the non-adherent cells were removed. Initial and remaining (attached) cells were quantified in independent wells using CellTiter-Glo (Promega). The fraction of attached cells in the miR-183 mimic relative to the control is shown as the mean ± standard deviation from at least three independent experiments. An unpaired t-test was applied to assess the statistical significance of the difference between conditions. (C) 72 h after transfection, the cells were harvested, plated on coverslips and allowed to spread for 3 h. The cells were then fixed, permeabilized and stained with Alexa Fluor 488-conjugated phalloidin to reveal the actin cytoskeleton. Images were captured with a Fluorescent Cell Imager using a monochrome camera and a magnification of 175×. Scale bars show 25 μm. Representative images are shown. (D) Cell area and circularity measured in cell adhesion assays of B were retrieved using ImageJ Software. Approximately 300 individual cells were analyzed for each cell line. A paired t-test was performed, considering the four cell lines as biological replicates, to assess the statistical significance between conditions. ** p-value < 0.1, ns = not significant.

