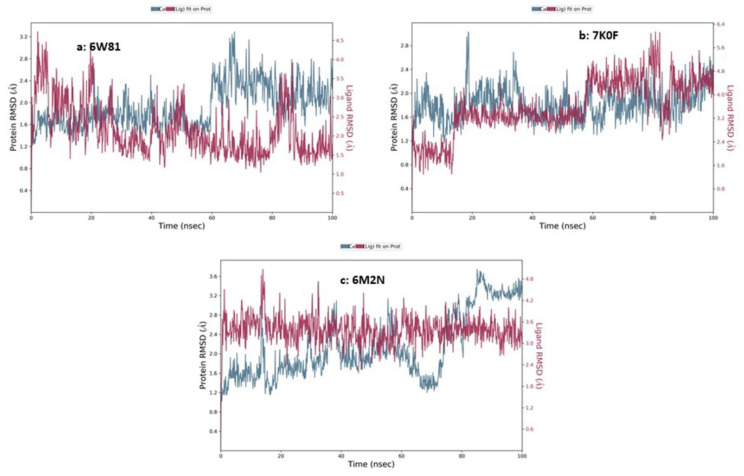
Figure 13.
RMSD analysis of MD simulation trajectory. The RMSD plot obtained for (a) chaetovirdin D-SARS-CoV-2 main protease complex (PDB ID 6W81), (b) chaetovirdin D-SARS-CoV-2 main protease complex (PDB ID 7K0F), and (c) chaetovirdin D-SARS-CoV-2 main protease complex (PDB ID 6M2N). The simulated time of 100 ns shows the formation of a stable complex without any significant conformational changes in protein structure.

