
Table 3.
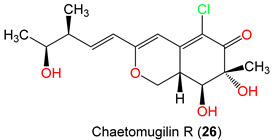
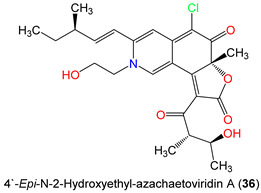
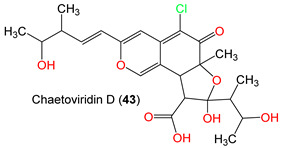
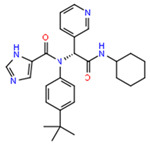
In silico screening results of top candidates of the reported chaetomugilins and chaetoviridins against SARS-CoV-2 3CL protease (PDB: 6W81, 6M2N, and 7K0F).
| Name & Structure | For 6W81 | For 6M2N | For 7K0F | |||||||||
|---|---|---|---|---|---|---|---|---|---|---|---|---|
| Docking Score | Glide Gscore | Glide Emodel | XP GScore | Docking Score | Glide Gscore | Glide Emodel | XP Gscore | Docking Score | Glide Gscore | Glide Emodel | XP Gscore | |
|
−6.901 | −6.918 | −45.952 | −6.918 | −6.862 | −6.879 | −40.382 | −6.879 | −6.428 | −6.445 | −45.402 | −6.445 |
|
−6.634 | −6.933 | −53.592 | −6.933 | −6.657 | −7.205 | −59.649 | −7.205 | −6.214 | −6.762 | −57.163 | −6.762 |
|
−7.293 | −7.294 | −52.497 | −7.294 | −7.851 | −7.851 | −46.384 | −7.851 | −6.886 | −6.904 | −44.124 | −6.904 |
|
−6.838 | −7.269 | −59.268 | −7.269 | −7.4 | −7.791 | −61.032 | −7.791 | −6.599 | −7.03 | −50.901 | −7.03 |
|
−6.94 | −6.958 | −40.421 | −6.958 | −6.921 | −6.939 | −42.35 | −6.939 | −6.886 | −6.904 | −44.124 | −6.904 |
|
−6.48 | −6.48 | −57.388 | −6.48 | −7.519 | −7.519 | −67.872 | −7.519 | −7.311 | −7.311 | −65.197 | −7.311 |
|
−7.944 | −7.944 | −51.069 | −7.944 | −8.141 | −8.141 | −48.92 | −8.141 | −6.615 | −6.615 | −60.199 | −6.615 |
 Ref_6W81 |
−5.377 | −5.377 | −86.001 | −5.377 | ||||||||
 Ref_6M2N |
−6.995 | −6.995 | −52.4 | −6.995 | ||||||||
 Ref_K0F |
−8.159 | −8.159 | −113.296 | −8.159 | ||||||||