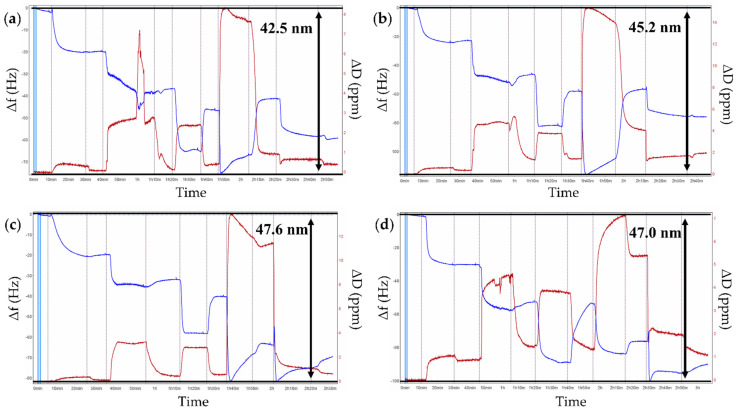
Figure 5.
Exemplary graphs of adsorption kinetic measurements of polyelectrolyte multilayers monitored by QCM-D: (a) PEI/CUR/ALG/CHIT/1; (b) PEI/CUR/ALG/CHIT/2; (c) PEI/CUR/ALG/CHIT/3; (d) PEI/CUR/ALG/CHIT/4. Blue lines illustrate frequency shifts (Δf), red lines illustrate dissipation shifts (ΔD) of polyelectrolyte multilayers. Resonance frequency variations and dissipation variations are recorded as a function of time. Normalised frequency and dissipation shifts are shown for the seventh overtone.

