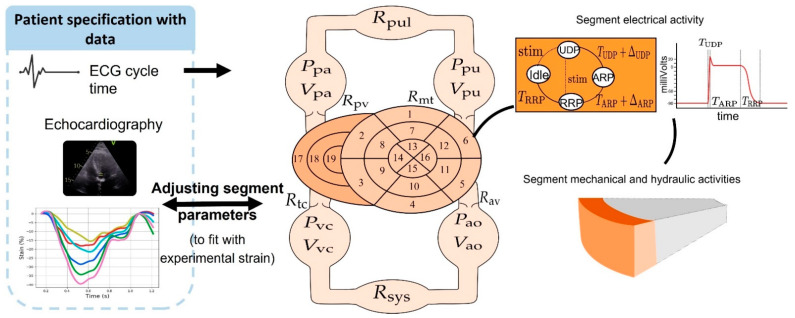
Figure 1.
Exemplification of the exploitation of ECG and echocardiographic data obtained from patients for the construction of an electro-mechanical heart model and characteristics of the model. ((Left) panel): ECG cycle-time and strain-derived curves obtained from each patient were compared to the outputs of the model and used to adjust the model’s outputs to increase the patient’s specification of the model. ((Middle) panel): Closed-loop model of the cardiovascular system including a multi-segment representation of the left and right ventricles. Numbers (1 to 19) represent the different cardiac segments: (1) basal anterior; (2) basal anteroseptal; (3) basal inferoseptal; (4) basal inferior; (5) basal inferolateral; (6) basal anterolateral; (7) mid anterior; (8) mid anteroseptal; (9) mid inferoseptal; (10) mid inferior; (11) mid inferolateral; (12) mid anterolateral; (13) apical anterior; (14) apical septal; (15) apical inferior; (16) apical lateral; (17) right ventricular basal; (18) right ventricular median; (19) right ventricular apical. The systemic (sys) and pulmonary (pul) circulations include: aorta (ao), vena cava (vc), pulmonary artery (pa), and pulmonary veins (pu). ((Right) panel): State diagram of the cellular automaton that shows the correspondence of the transition parameters with the myocardial action potential dynamic.

