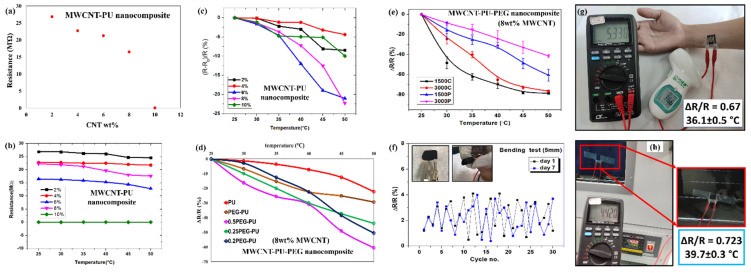
Figure 5.
Graphical representation of (a) resistance variation with MWCNT loading wt.% in PU; (b) change in resistance with temperature of MWCNT-PU nanocomposite; (c) variation of ΔR/R with temperature in MWCNT-PU nanocomposite; (d) thermoresistive response by means of ΔR/R vs. temperature graph of physically mixed MWCNT-PEG-PU nanocomposites with different ratios; (e) a comparison of thermoresistive behavior of physically mixed (PEG1500P and PEG3000P) and chemical crosslinked (PEG1500C and PEG3000C) MWCNT-PEG-PU nanocomposite sensor; (f) continuous flexibility test of the fabricated sensor with a bending diameter of 5 mm on day 1 and day 7; temperature measurement test of fabricated sensor (g) on a human hand and a comparison with a temperature IR gun (h) on oven glass, which was fixed at a temperature of 40 °C, the observed temperature is shown on the bases of ΔR/R.

