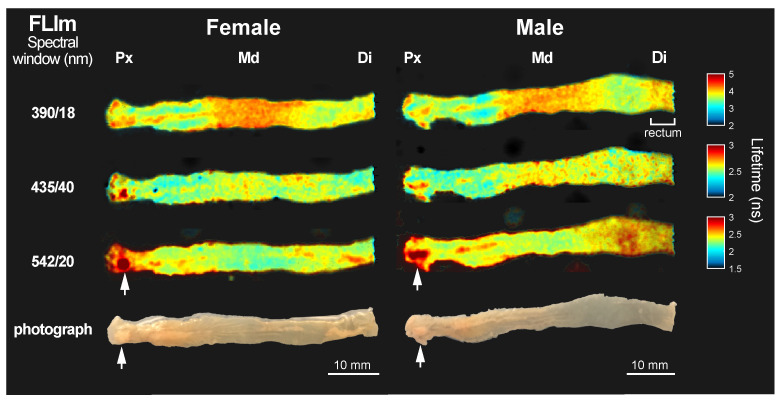
Figure 1.
Fluorescence lifetime maps of exposed colon lumen from two representative samples, a female and a male subject, at spectral windows 390/18 nm, 435/40 nm, and 542/20 nm. The corresponding photograph of each colon luminal surface is included in the bottom row. The color bar for the lifetime maps of each spectral band has been adjusted to maximize contrast. White arrowheads point to fat accumulations in the samples. Three anatomical regions are identified as proximal (Px), middle (Md), and distal (Di) colon. This male sample also shows distinct lifetime in the rectum.

