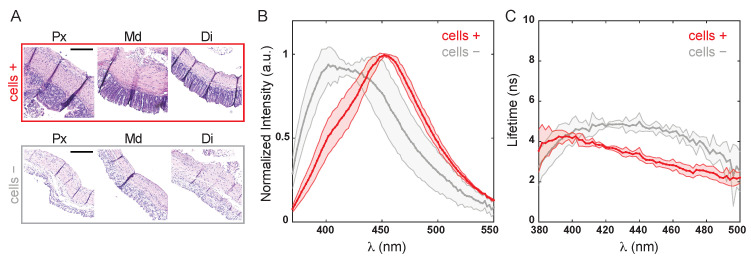
Figure 2.
Fluorescence tissue properties of mice colon before (cells +) and after (cells −) removing endothelial colonocytes. (A). Hematoxylin and Eosin (H&E) stain of tissue sections from the proximal (Px), middle (Md), and distal (Di) colon. Scale bar = 200 m. (B). Normalized autofluorescence emission spectra and (C) lifetime spectra.

