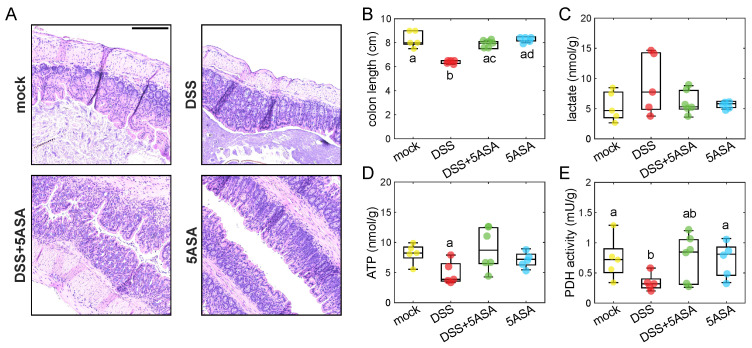
Figure 4.
(A) Representative H&E images of distal colon sections from each group. Scale bar = 200 m. Biochemical measurements on the imaged colons include colon length (B), intracellular lactate (C), ATP levels (D), and PDH activity (E). Pairwise Mann–Whitney U test was applied to test statistical differences between groups.

