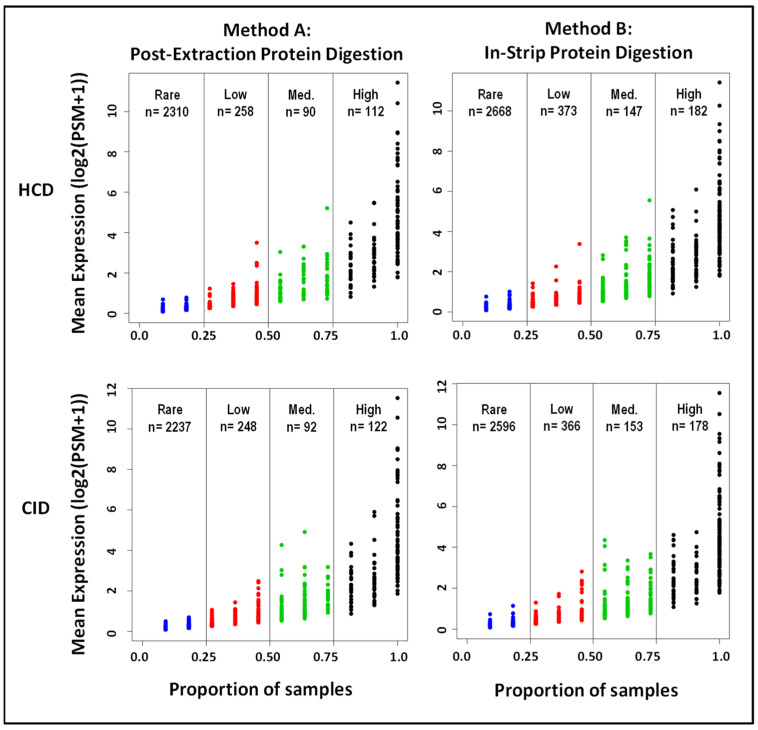
Figure 3.
Distribution of mean protein expression by sample proportion in the four different workflows. Peptide–spectrum matches (PSMs) from the 11 tear samples were log2 transformed for each digestion and fragmentation method performed to compare differences in mean protein expression between workflows. Further, proteins detected in the 11 samples were proportionally assessed and subdivided into four categories based on trends of detection for each method: High (shown in black; detected in >75% of samples), Medium (shown in green; detected in 50–75%), Low (shown in red; detected in 25–50%), and Rare (shown in blue; detected in 5–25%).

