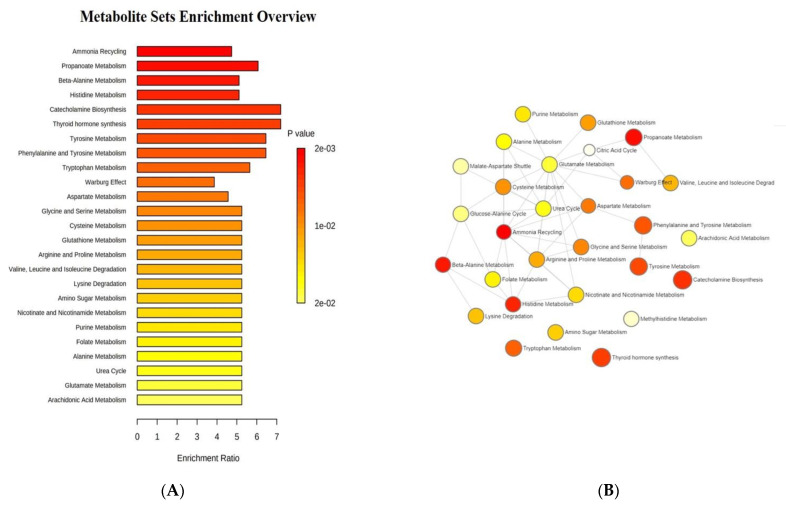
Figure 2.
Enrichment analysis: (A) list of the most significantly discriminant pathways between ASD children and their unaffected siblings; (B) network analysis illustrating the most significant relationships between perturbed biochemical pathways in our group of autistic children. Metabolic pathways are represented as circles according to their scores from enrichment (vertical axis) and topology analyses (pathway impact, horizontal axis). Darker circle colors indicate more significant changes of metabolites in the corresponding pathway. The size of the circle corresponds to the pathway impact score and is correlated with the centrality of the involved metabolites.

