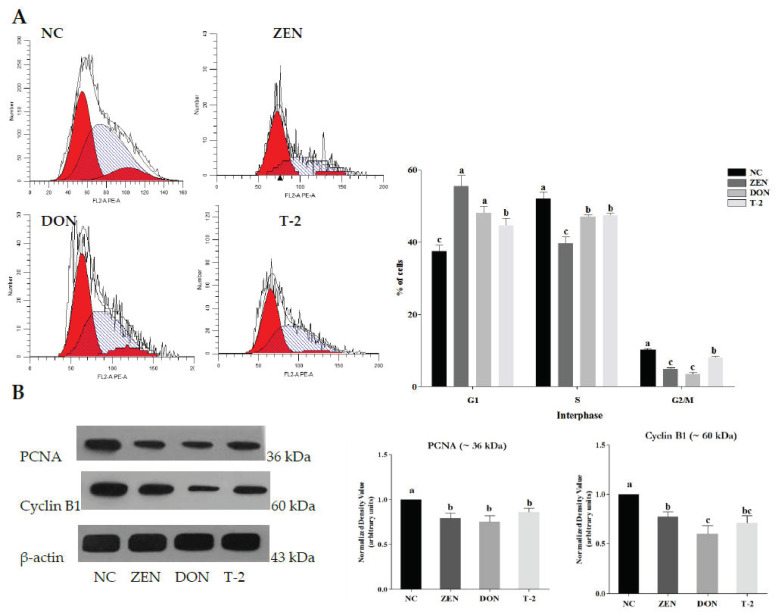
Figure 2.
Effects of zearalenone (ZEN), deoxynivalenol (DON) and T-2 toxin (T-2) on cell cycle distribution in Leydig cells were analyzed by flow cytometry (A); protein expression of PCNA and cyclin B1 were detected using Western blotting (B); β-actin was detected as control. Values represent means ± SEM of triplicate results. Bar graph shows the relative expression of protein among the groups. The letters a, b, and c above the bars denote significant differences between groups (p < 0.05, one-way ANOVA).

