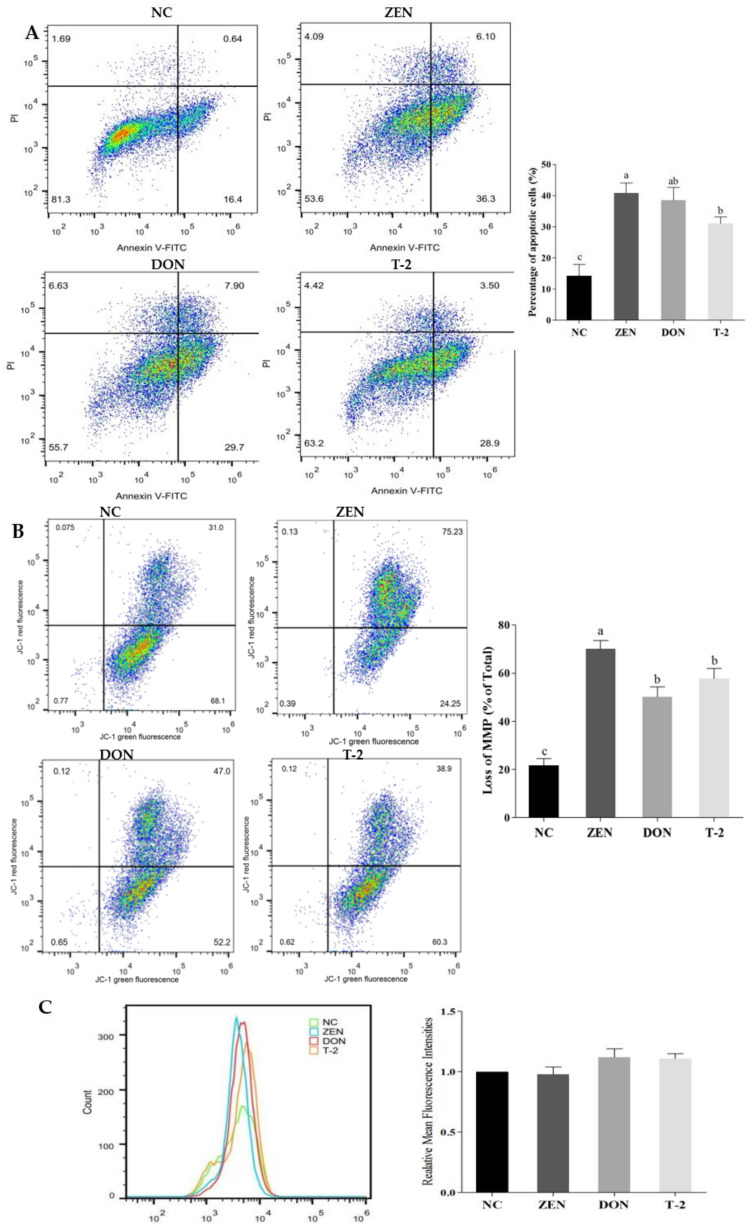
Figure 3.
Effects of ZEN, DON and T-2 on the regulation of cell apoptosis, MMP and ROS levels in porcine Leydig cells. (A) The apoptotic cells were assessed by flow cytometry Annexin V-FITC/PI staining, (B) Changes in MMP were measured by JC-1 assay using flow cytometry. The loss of MMP was calculated by red/green fluorescence as 100%, (C) Intracellular ROS production was assessed by flow cytometry followed by DCFH-DA staining. Relative fluorescence intensity (RFI) of ROS is represented as the ratio relative to the control experiment. Values represent means ± SEM of triplicate results. The letters a, b, and c above the bars denote significant differences between groups (p < 0.05, one-way ANOVA).

