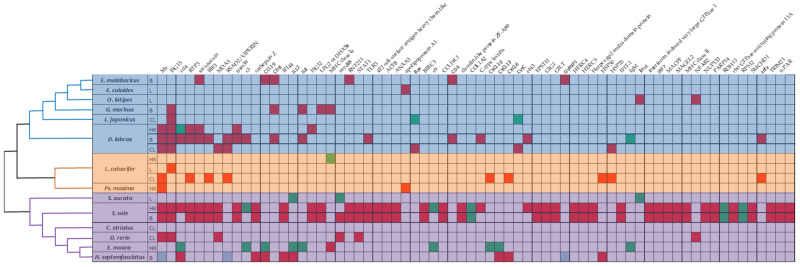
Figure 2.
Diagram of fish and genes information of the articles incorporated in systematic review. (Top) genes which appear at least 2 times in different fish species/tissues (red, up-regulated genes; green, down-regulated genes; blue, de-regulated genes). (Left) phylogeny of the fish species, including different analyzed tissue information (B, brain; C, cell line; HK, head kidney; L, larvae). The tree is not drawn to scale.

