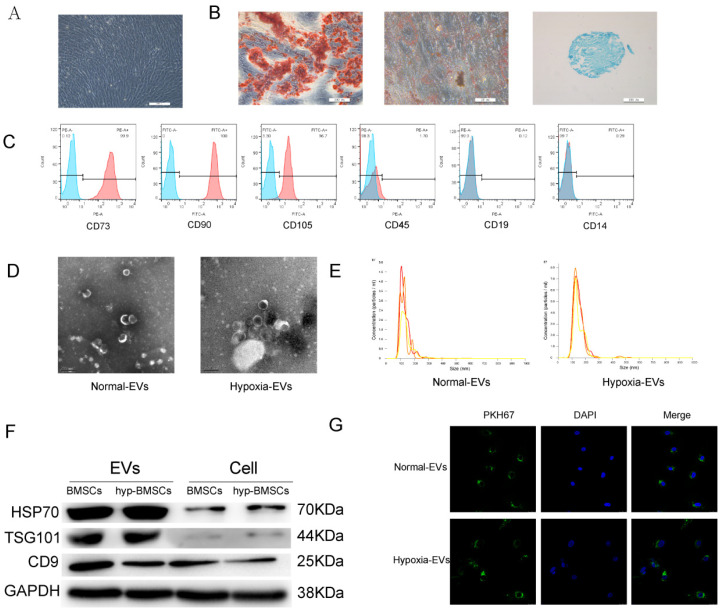
Figure 1.
Identification of BMSCs and BMSC-EVs. (A) BMSCs showed a spindle-like shape (Scale bar = 200 µm). (B) BMSCs were induced to differentiate into osteoblast (Scale bar = 200 µm), adipose cells (Scale bar = 50 µm), and chondroblast cells (Scale bar = 200 µm). (C) Flow cytometry analysis of the cell surface markers on BMSCs. (D) Morphology of the exosomes under transmission electron microscopy. (Scale bar = 200 nm). (E) Particle size distribution of BMSC-EVs as measured by Nanosight. (F) Western blot analysis of the EV-specific CD9, CD70, and TSG101 proteins. (G) Detection of BMSC-EVs uptake by chondrocytes. PKH67 is shown in red, and DAPI is shown in blue (Scale bar = 20 µm).

