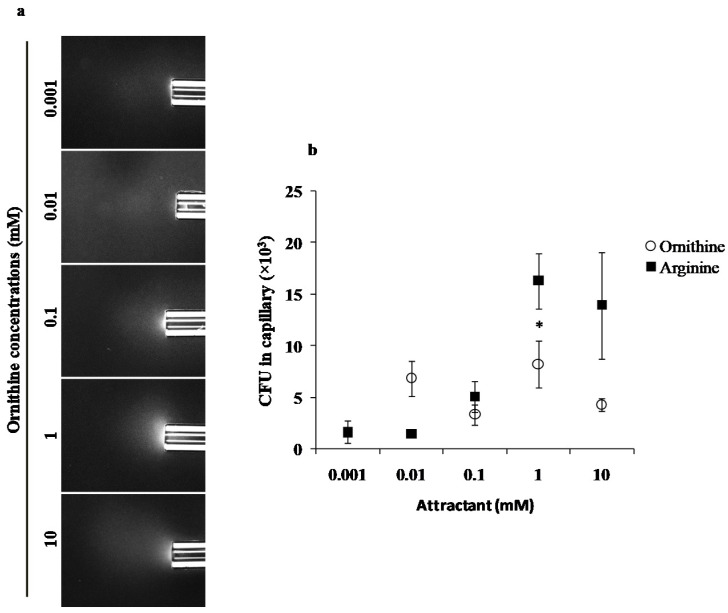
Figure 1.
Capillary chemotaxis assays of PAO1 towards different l-ornithine concentrations. (a) Dark-field images of cells gathered at the mouth of capillaries containing attractants. All photographs were taken after 5 min. A normalization of the response visualized at 5 min with respect to the time 0 min for each treatment is represented with a jet Colormap (MATLAB R2013b version 8.2) in Supplementary Figure S1. (b) Quantitative chemotaxis response of PAO1 towards different l-ornithine and l-arginine concentrations. Results are averages of at least 12 capillaries from five independent experiments; the results have been normalized with CB as the negative control; error bars indicate standard errors, * p < 0.05 (by Tukey’s test).

