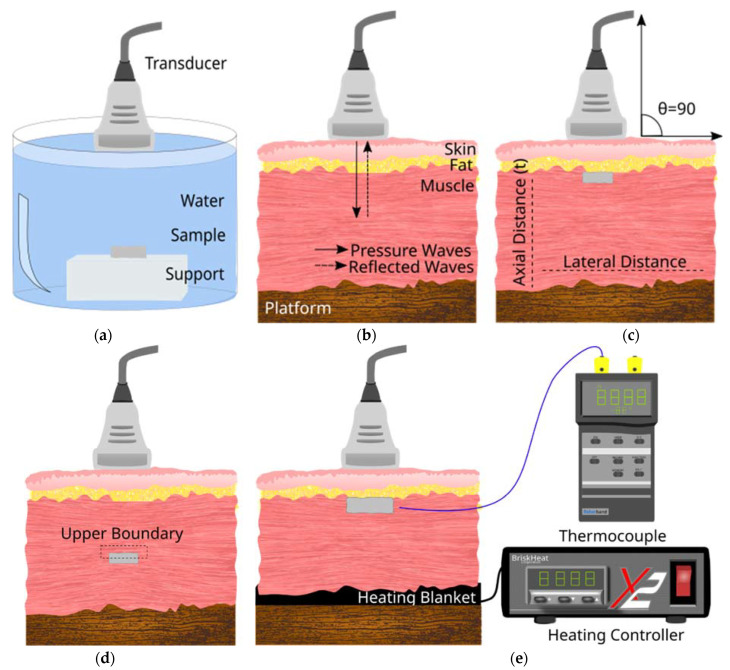
Figure 1.
Schematic diagram of the cross-section view of the different configurations used for diagnostic US imaging of aerogel. (a) Aerogel samples were tested in an Aq environment by placing them on top of sample support. (b) Configuration used to image the tissue without any implants. This served as the baseline for image analysis. Continuous arrows show pressure waves propagating and though the tissue and implant. Discontinuous arrows show reflected pressure waves from the Z difference within the tissue and implant area. (c) Configuration where implant insertion is SC (d) Configuration where implant insertion is SM. (e) Configuration with temperature controlling heating blanket and thermocouple for US imaging at different temperatures. The angle of scan was maintained at 90° that corresponds to the 0° in US device settings.

