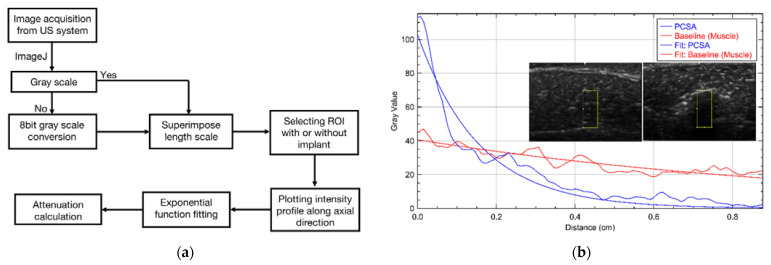
Figure 2.
(a) Flowchart showing the attenuation analysis procedure used in this study. US images were exported to ImageJ (NIH open-source software) to scale the measurements, selecting the region of interest (ROI) and exponentially fitting the intensity profile at 6.5 MHz frequency. (b) Representation of exponential fit of selected ROI of two different B-mode images of baseline (left) and PCSA (right) at 6.5 MHz frequency.

