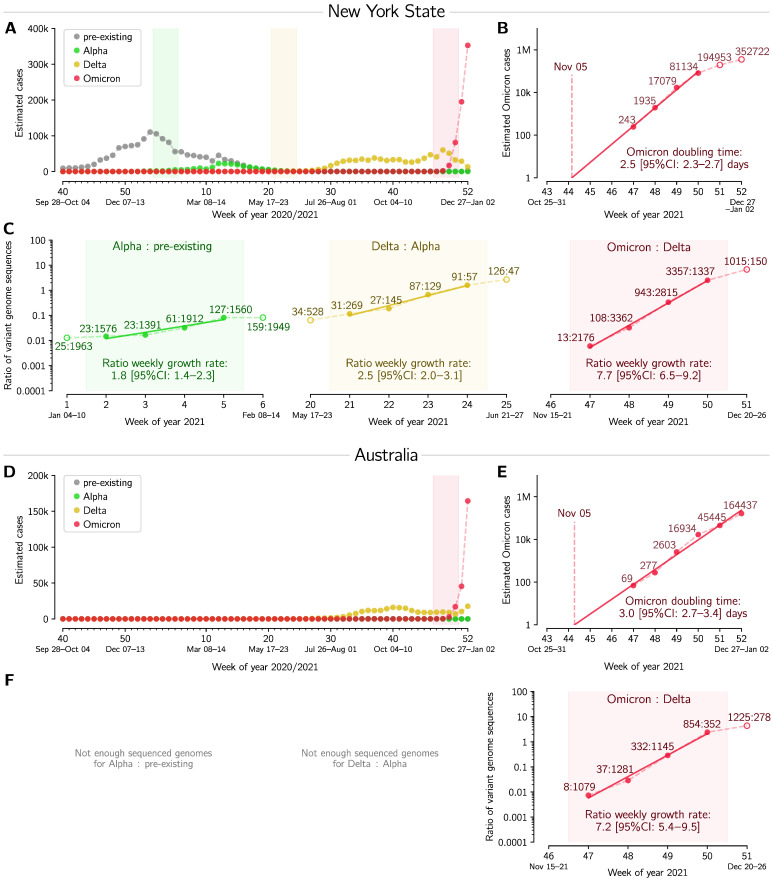
Figure 3.
Succession of SARS-CoV-2 strains in New York State and in Australia. (A,D) Estimated number of weekly cases infected with a particular strain over the weeks of 2020 and 2021. (B,E) Estimated number of weekly Omicron cases and the doubling time estimate based on log–linear regression in four (Panel (B)) and six (Panel (E)) whole-week periods (filled circles). (C,F) Ratios of weekly cases of an emergent strain to the previously dominant strain, and the estimate of ratios’ growth rates based on log–linear regression in four whole-week periods (subpanels correspond to shaded regions in respective panels(A,D)). A dataset for this figure is provided as Supplementary Table S5.

