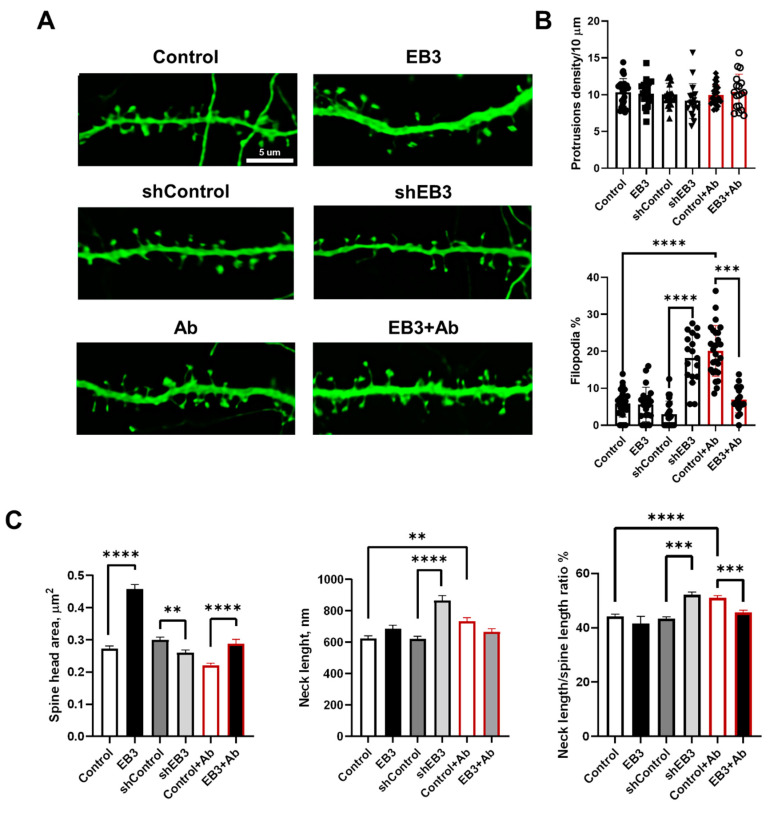
Figure 2.
EB3 expression levels shape hippocampal dendritic spine morphology in WT neurons and in the condition of amyloid toxicity. (A) Confocal images of WT primary hippocampal dendrites and dendrites in the condition of amyloid toxicity (Ab) transfected with GFP or co-transfected with GFP and EB3, plasmid encoding control RNAi (shControl) or RNAi against EB3 (shEB3) at DIV 8-9, and fixed at DIV 16-17. Scale bar corresponds to 5μm. (B) The number of protrusions per 10 μm dendrite length and fraction of filopodia for each group of cells shown on panel A. (C) Direct morphometric measurements of dendritic spines morphology including spine head area, neck length, and neck length/spine length ratio. **: p < 0.01; ***: p < 0.001, ****: p < 0.0001. ANOVA test for protrusions density, Kruskal–Wallis test with post-hoc Dunn’s test for other data. n ≥ 18 neurons and n ≥ 230 spines from 3 batches of cultures.

