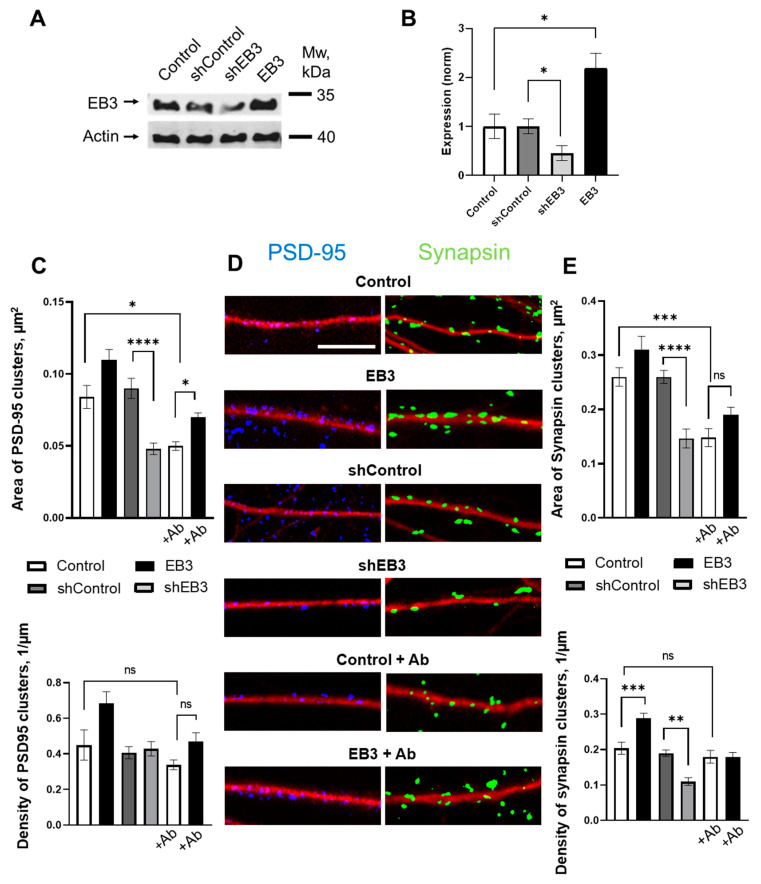
Figure 3.
EB3 affects PSD-95 and Synapsin protein clustering. (A) The efficiency of EB3 expression level regulation generated in HEK293T cells Lentiviral particles were analyzed by Western blotting the primary hippocampal cultures infected with lentiviruses encoding EB3, control RNAi (shControl), or RNAi against EB3 (shEB3) at DIV 7-8 and lysed at DIV 15. Actin was used as a loading control. (B) Quantification of EB3 expression level (normalized to actin levels). The mean density of each band was normalized to an actin signal in the same sample and averaged. n = 4 batches of culture, *: p < 0.05. (C) Area and density of PSD-95 protein clusters for each group of cells shown on panel D. (D) Binarized confocal images of WT hippocampal dendrites and dendrites treated with beta-amyloid, infected with lentiviruses encoding EB3, control RNAi (shControl) or RNAi against EB3 (shEB3) at DIV 7 and fixed at DIV 14 and stained anti-MAP2 (red), anti-PSD95 (blue), and anti-Synapsin (green). Scale bar corresponds to 5μm. (E) Area and density of Synapsin protein clusters for each group of cells shown on panel D. *: p < 0.05, **: p < 0.01, ***: p < 0.001, ****: p < 0.0001, ns-no statistically significant difference. Tamhane’s T3 test for PSD95 clusters area, Kruskal–Wallis test with post-hoc Dunn’s test for other data. n ≥ 25 neurons from 3 to 5 batches of cultures.

