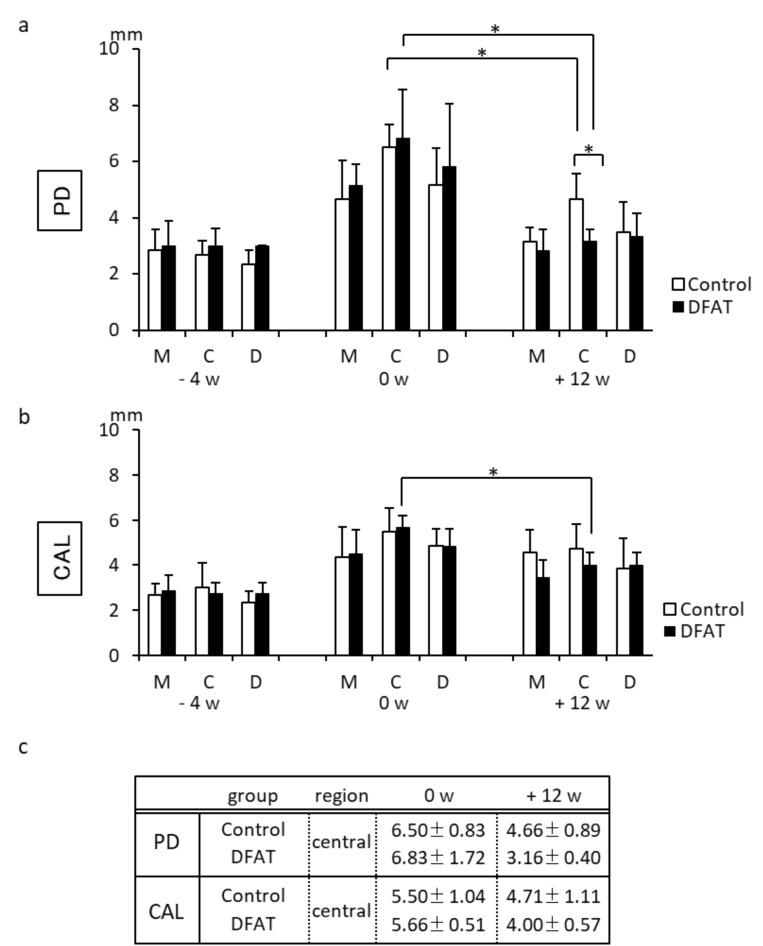
Figure 4.
Clinical parameters at the buccal surface of the mandibular second premolar at three different time points. (a) In the control group, a significant difference was observed in the central area of the second premolar between 0 and +12 weeks. In the DFAT group, significant differences were observed in the whole area of the second premolar between 0 and +12 weeks. In addition, a significant difference was observed in the central area between the control group and DFAT group at +12 weeks. (b) A significant difference was observed in the central area of the DFAT group between 0 and +12 weeks. Each bar represents the mean ± SD (n = 6, * p < 0.05). M, mesial; C, central; D, distal. (c) Results of mean values (±SD) in central region of DFAT group and control group between 0 and +12 weeks (mm).

