Figure 7.
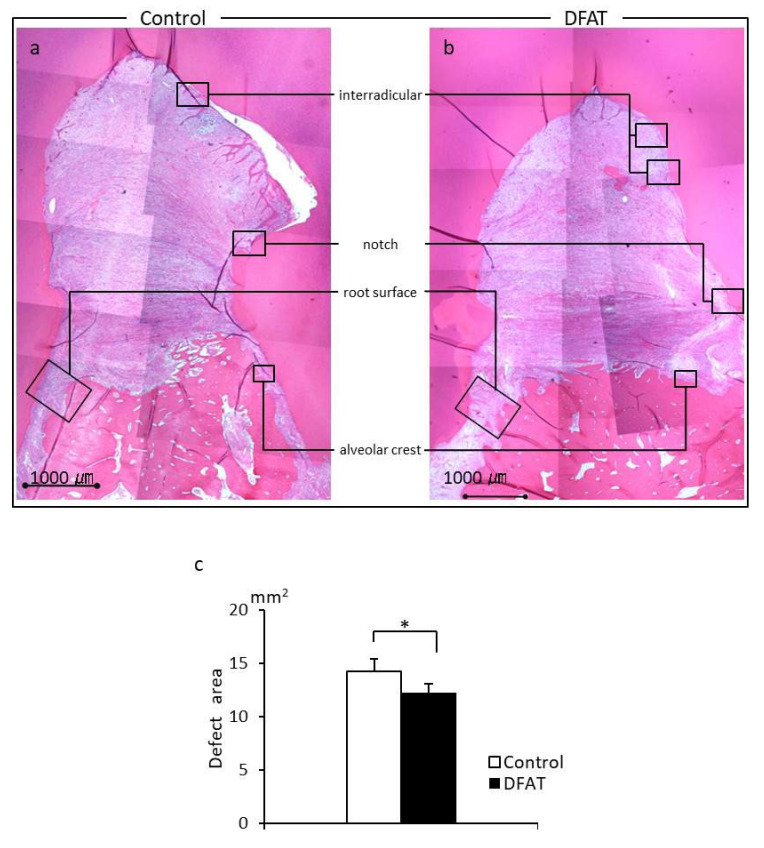
Representative H&E-stained sagittal plane section from the furcation of the second premolar at +12 weeks. Furcation defects in the control group (a) and DFAT group (b) were easily identified in the central part of the image. (c) Quantification of the defect area. The defect area was smaller in the DFAT group that in the control group. Each bar represents the mean ± SD (n = 6, * p < 0.05).

