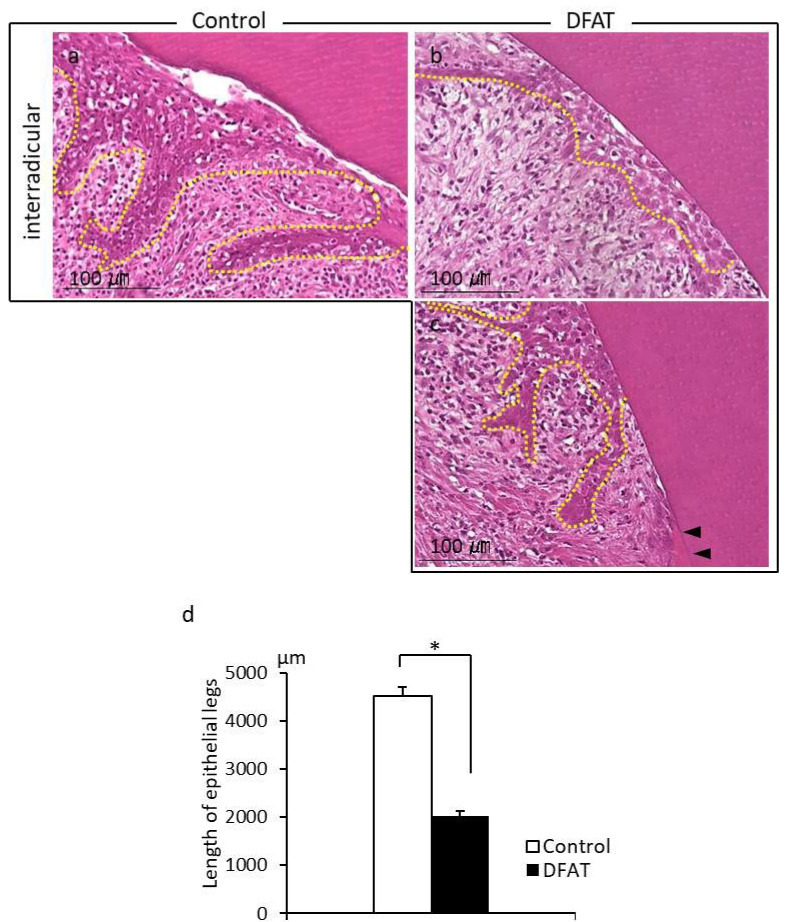
Figure 8.
High-magnification image of interradicular regions from Figure 7. (a) Control group; the dotted line indicates epithelial legs reaching the upper section of the furcation defect. (b) DFAT group; the dotted line indicates epithelial tissue in the upper section of the furcation defect. (c) The dotted line indicates epithelial legs above the hard tissue formation. Black arrowheads indicate newly formed cementum. (d) The length of epithelial legs was longer in the control group than in the DFAT group. Each bar represents the mean ± SD (n = 6, * p < 0.05).

