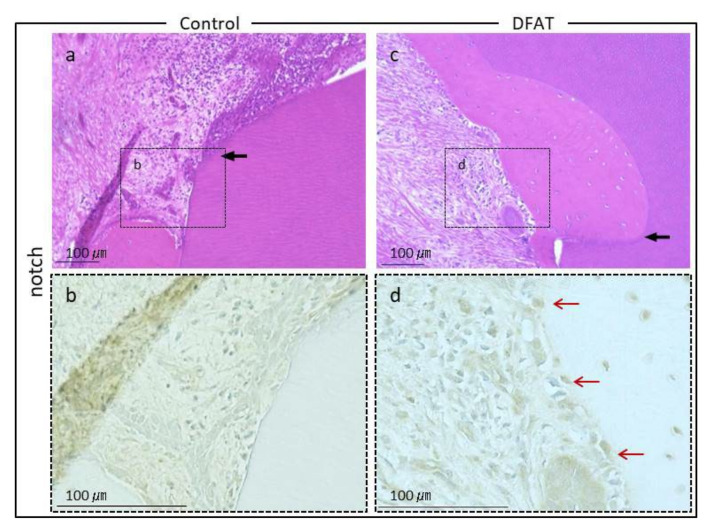
Figure 9.
Magnified notch regions of Figure 7. (a) In the control group, epithelial tissue was observed above the notch of the created defect (black arrow). (b) At higher magnification of the dotted frame in (a), immunocytochemistry revealed no cementoblasts in the created defect. (c) In DFAT group, defect sites and eosinophilic structures were observed within the created furcation defect (black arrow). (d) At higher magnification of dotted frame in (c), immunocytochemistry revealed periostin-positive cells in the newly formed cementum. Red arrows indicate the newly formed cementoblasts.

