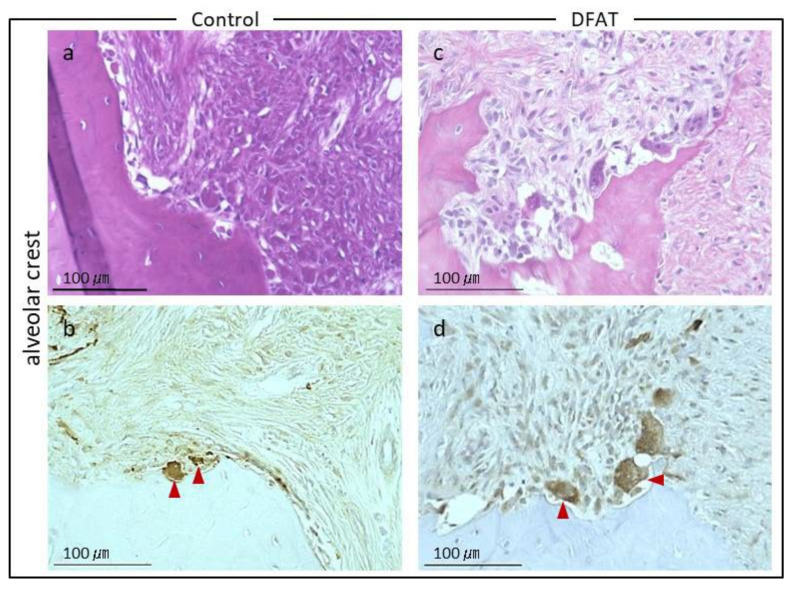
Figure 11.
High-magnification image of alveolar crest regions from Figure 7. (a) H&E-stained micrographs from the control group. (b) Immunocytochemistry photomicrographs. Red arrows indicate cathepsin K-positive osteoclasts in the control group. (c) H&E-stained micrographs in the DFAT group. (d) Immunocytochemistry photomicrographs. Red arrowheads indicate cathepsin K-positive osteoclasts lining the newly formed alveolar crest in the DFAT group.

