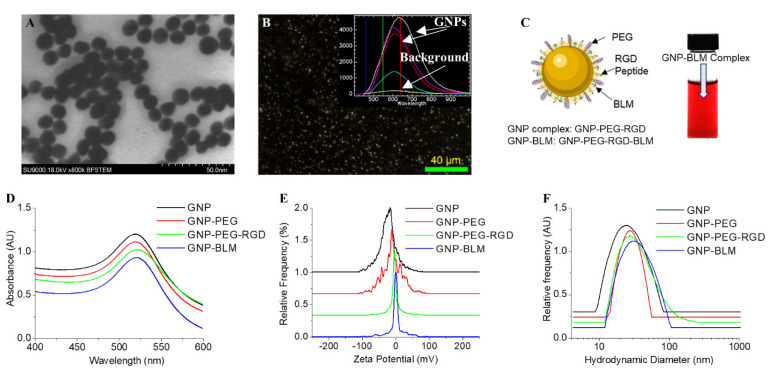
Figure 1.
Characterization of NP complexes. (A) TEM image of as-made GNPs. (B) Darkfield image of GNPs where bright spots are GNPs. Inset figure shows the spectra collected from few of those bright spots using hyperspectral imaging feature. (C) Schematic showing the molecules used for functionalization of GNPs (left) and a vial containing the final GNP-BLM complex (right). (D–F) UV visible absorption, zeta potential, and hydrodynamic diameter of GNP (as-made), GNP-PEG, GNP-PEG-RGD, GNP-BLM, respectively. There is a y offset for D–F for clarity.

