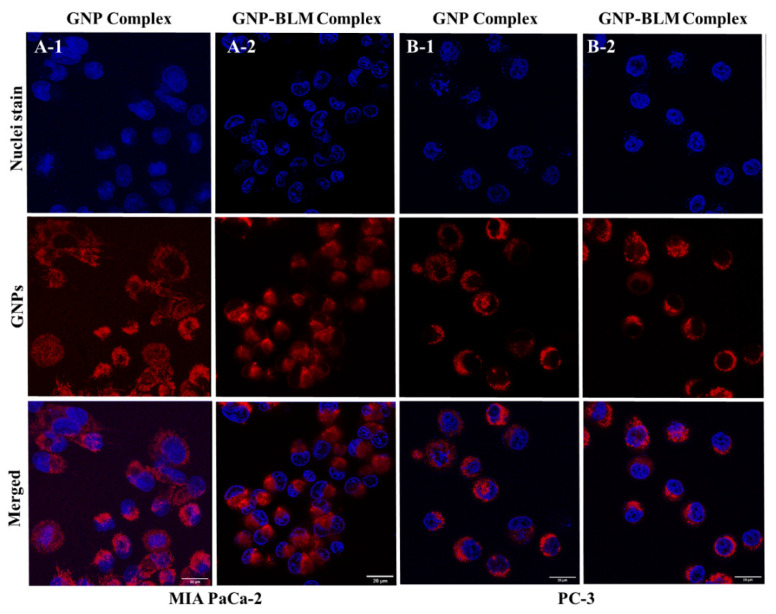
Figure 4.
Qualitative analysis of cellular uptake of GNP complexes using confocal imaging. (A) NPs localized within MIA PaCa-2 cells. (A-1) GNP complex; (A-2) GNP-BLM complex. (B) NPs localized within PC-3 cells. (B-1) GNP complex; (B-2) GNP-BLM complex. GNPs are labeled in red and nuclei are labeled in blue. (Scale bar = 20 μm).

