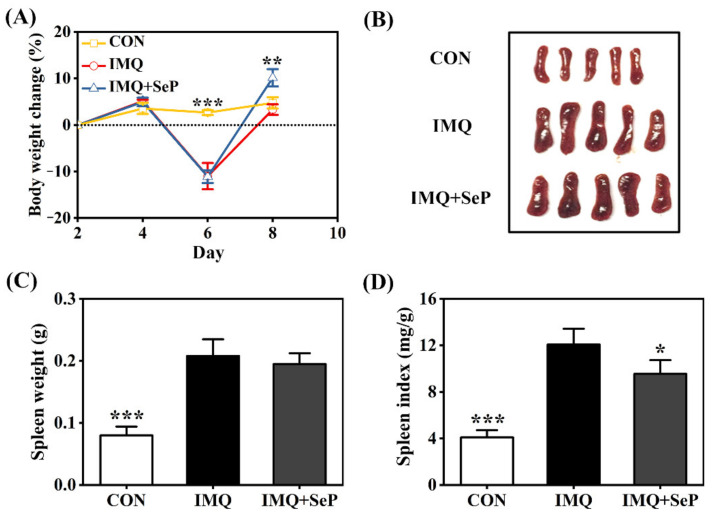
Figure 2.
Influence of SeP on the IMQ-induced systemic side effects in mice. (A) Percent change of body weight of mice from day 2 to day 8. The body weight of mice on day 2 was used as baseline initial values in each group. (B) The photos of spleen tissues of each group (5 mice) on day 9. (C) Spleen weight. (D) Spleen index (spleen weight/body weight). Data were expressed as mean ± SD (n = 6). * p < 0.05, ** p < 0.01, *** p < 0.001, compared with the IMQ group.

