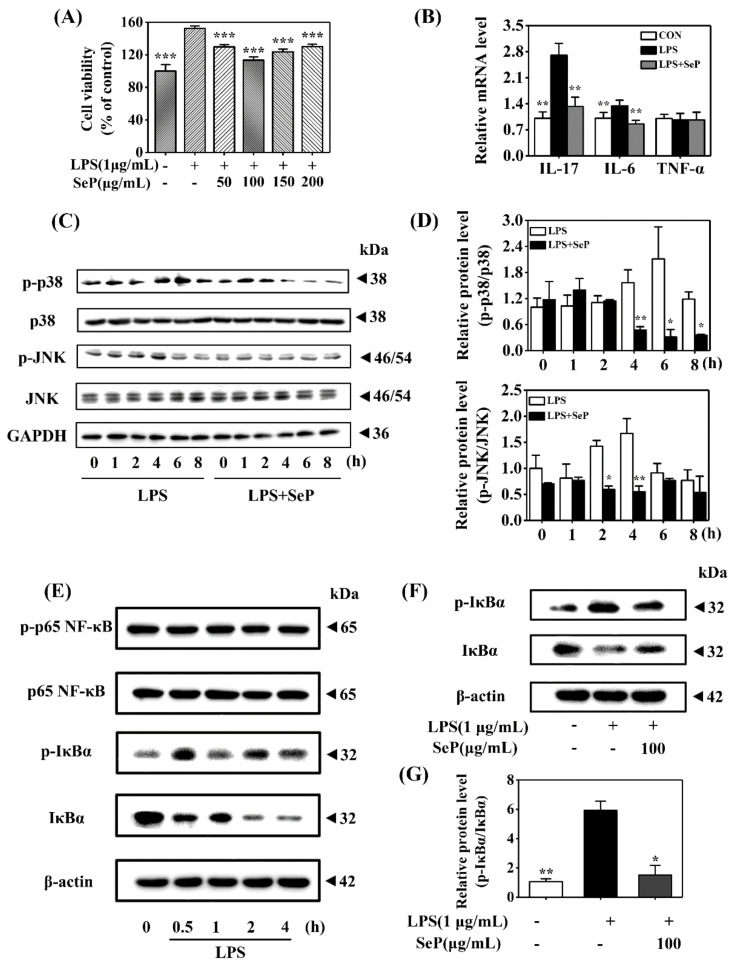
Figure 5.
Effect of SeP on cell viability, pro-inflammatory cytokines expression, and the activation of MAPK and NF-κB signaling pathways in LPS-stimulated HaCaT cells. (A) SeP pretreatment suppressed the cell proliferation induced by LPS. After pretreated with indicated dose of SeP for 24 h, HaCaT cells were exposed to LPS (1 µg/mL) for another 24 h. MTT assay was used to determine the cell viability (means ± SD, n = 4). (B) SeP reduced the expression of IL-17A and IL-6 induced by LPS. Cells were pretreated with SeP (100 µg/mL) for 24 h and then exposed to LPS (1 µg/mL) for another 12 h. RT-qPCR assay was performed to measure the mRNA level of pro-inflammatory cytokines (means ± SD, n = 4). (C,D) SeP suppressed LPS-induced the activation of p38 and JNK MAPK in HaCaT cells. After pretreatment with or without SeP (100 µg/mL) for 12 h, cells were stimulated with LPS for another indicated times (0, 1, 2, 4, 6 and 8 h). Western blot analysis was used to determine the protein levels of p-p38, p38, p-JNK and JNK. (C) Representative Western blot bands of p-p38, p38, p-JNK and JNK. (D) Semi-quantification analysis of p-p38 MAPK normalized to p38 MAPK (upper panel) and p-JNK normalized to JNK (lower panel) (mean ± SD, n = 3). (E) LPS activated NF-κB signaling pathway in HaCaT cells. Cells were stimulated by LPS (1 µg/mL) for indicated times (0, 0.5, 1, 2 and 4 h), and the protein levels of phosphorylated p65 (p-p65), p65, p-IκBα and IκBα were detected by Western blot analysis. Representative Western blot bands were shown. (F,G) SeP suppressed LPS-induced the activation of NF-κB signaling pathway in HaCaT cells. Cells were pretreated with or without SeP (100 µg/mL) for 12 h and then stimulated with LPS (1 µg/mL) for another 0.5 h. Western blot analysis was done to measure the protein levels of p-IκBα and IκBα. (F) Representative Western blot bands. (G) Semi-quantification analysis of p-IκBα normalized to IκBα (mean ± SD, n = 3). Each band image was representative of three experiments. * p < 0.05, ** p < 0.01, *** p < 0.001, compared with cells treated with LPS only.

