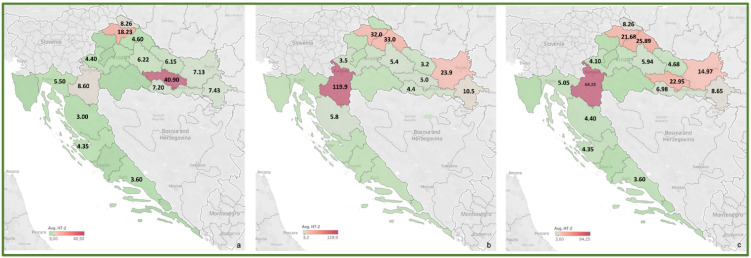
Figure 7.
Heat maps of HT-2 occurrence in Croatian cereals from the harvests of 2016 (a), 2017 (b) and 2016–2017 (c). The range of found concentrations of HT-2 (legend Avg. HT-2) is shown in green (low concentration) and purple (high concentration). In 2016, (a) HT-2 was found in concentrations 3.00–40.90 µg/kg, while in 2017 (b) in concentrations 3.2–119.9 µg/kg.

