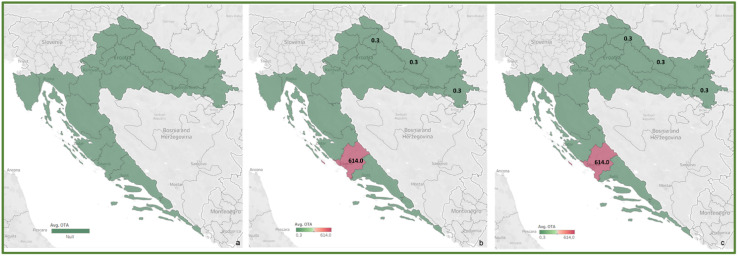
Figure 8.
Heat maps of OTA occurrence in Croatian cereals from the harvests of 2016 (a), 2017 (b) and 2016–2017 (c). The range of found concentrations of OTA (legend Avg. OTA) is shown in green (low concentration) and purple (high concentration). In 2016, (a) OTA was not found, while in 2017 (b) it was found in concentrations 0.3–614 µg/kg.

