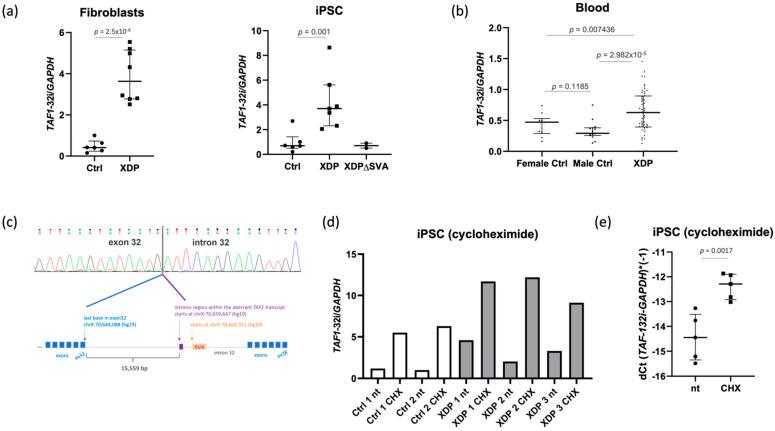
Figure 1.
TAF1-32i transcript in cells of healthy controls and patients with XDP. (a) qPCR results of fibroblasts (n = 6 controls; n = 8 patients) and induced pluripotent stem cells (iPSC; n = 6 controls; n = 7 patients; n = 2 XDPΔSVA cell lines), normalized to GAPDH levels. XDPΔSVA refers to the patient-derived cell lines where the SVA was excised by CRISPR/Cas9. t test was performed on dCt values. (b) qPCR results (n = 10 female controls; n = 15 male controls; n = 50 patients) on blood-derived cDNA samples, relative to GAPDH. p values result from pair-wise Wilcoxon rank-sum test. To overcome possible batch effects, two independent samples were measured repeatedly in each batch, and all other samples were corrected according to the mean changes in measurement for these two samples. (c) Sanger sequencing showing the sequence of the intronic region included in the transcript and the scheme explaining the genomic locations, with genomic coordinates in the hg19/GRCh37 assembly. Blue squares represent canonical TAF1 exons, the violet square represents the intronic region within the transcript (not drawn to scale). (d) qPCR results showing increased levels of the TAF1-32i transcript in control (n = 2) and patient-derived cells (n = 3) after cycloheximide (CHX) treatment, as compared to the non-treated (nt) cells. (e) t test on dCt values, comparing non-treated and CHX-treated samples. Ctrl, control.

