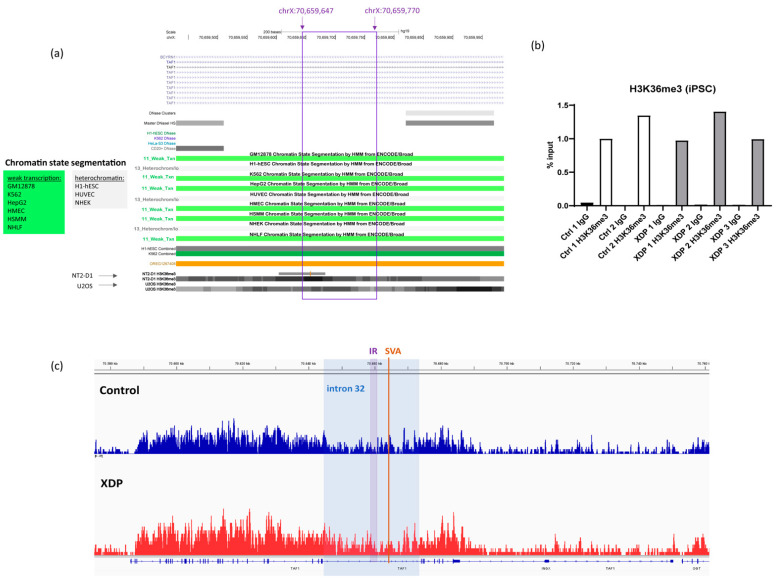
Figure 2.
H3K36me3 levels at the intronic region included in the transcript. (a) USCS browser screenshot, showing chromatin state segmentation and H3K36me3 histone mark in different cell lines. Note that the strongest signal is present in NT2-D1 cells. The region marked in violet is included in the transcript, and its genomic coordinates are shown above. (b) ChIP-qPCR results from control (n = 2) and XDP (n = 3) iPSC lines. Results are calculated relative to the corresponding input sample and shown as % input. (c) ChIP-seq results showing the TAF1 locus in control (blue) and XDP-derived (red) iPSCs. The region highlighted in blue depicts TAF1 intron 32; the narrower region marked as IR indicates the intronic region retained in the TAF1-32i transcript, and the orange line marks the position in which the SVA is inserted.

